原理:
Gene Ontology(简称GO)是一个国际标准化的基因功能分类体系,提供了一套动态更新的标准词汇表(controlled vocabulary)来全面描述生物体中基因和基因产物的属性。GO总共有三个ontology(本体),分别描述基因的分子功能(molecular function)、细胞组分(cellular component)、参与的生物过程(biological process)。GO的基本单位是term(词条、节点),每个term都对应一个属性。GO功能分析一方面给出差异表达基因的GO功能分类注释;另一方面给出差异表达基因的GO功能显著性富集分析。 首先,我们将差异表达基因向GO数据库(http://www.geneontology.org/)的各term映射,并计算每个term的基因数,从而得到具有某个GO功能的基因列表及基因数目统计。然后应用超几何检验,找出与整个基因组背景相比,在差异表达基因中显著富集的GO条目。
P的计算公式:

其中,N为所有Unigene中具有GO注释的基因数目;n为N中差异表达基因的数目;M为所有Unigene中注释为某特定GO term的基因数目;m为注释为某特定GO term的差异表达基因数目。计算得到的pvalue通过FDR校正之后,以corrected-pvalue≤0.05为阈值,满足此条件的GO term定义为在差异表达基因中显著富集的GO term。通过GO功能显著性富集分析能确定差异表达基因行使的主要生物学功能。
功能:
输入基因集或差异分析基因集,通过预设定参数,进行GO富集分析并将分析结果进行精美图形可视化,输出图形有富集气泡图、富集条形图、富集圈图、z-score气泡图、网络图、二级分类统计图(输出图形可选)。
适用范围:
可对18个常见物种的基因集进行富集分析,牛、斑马鱼、人、猕猴、小鼠、大鼠、猪、秀丽线虫、果蝇、拟南芥、水稻、番茄、小麦、玉米、酵母、山羊、鸡、籼稻,并且提供3个基因组版本;
也可以自行准备研究物种的背景基因进行富集分析。
输入:(文件格式和GO富集分析相同)
① 富集的目的基因列表,即想要研究的基因列表,可选择输入两种文件类型,有无差异基因列;两种上传方式,手动输入/上传文件。
文件支持txt(制表符分隔)文本文件、csv(逗号分隔)文本文件、以及Excel专用的xlsx格式,同样支持旧版Excel的xls(Excel 97-2003 )格式。
Nodiff文件格式:
| Unigene117178 |
| Unigene129340 |
| Unigene66777 |
| Unigene78052 |
|
Unigene171181 |
Diff文件格式:
| Unigene117178 | 14.433051 |
| Unigene129340 | 8.27829505 |
| Unigene66777 | 10.68610256 |
| Unigene77686 | 8.170500036 |
| Unigene78052 | 8.083759015 |
提示:如果没有加入基因的差异倍数(即选择输入Nodiff文件格式),则不会输出富集差异z-score气泡图。
② 背景基因总表,如果是有参考基因组的模式生物,可以直接使用已有参考基因作为背景基因文件。目前提供的物种有水稻、拟南芥、小鼠、大鼠、斑马鱼、鸡、秀丽线虫、果蝇、人。ID类型可选择基因ID或转录本ID,根据富集目的基因的ID类型决定。可以点击“预览参考文件”来查看具体ID。
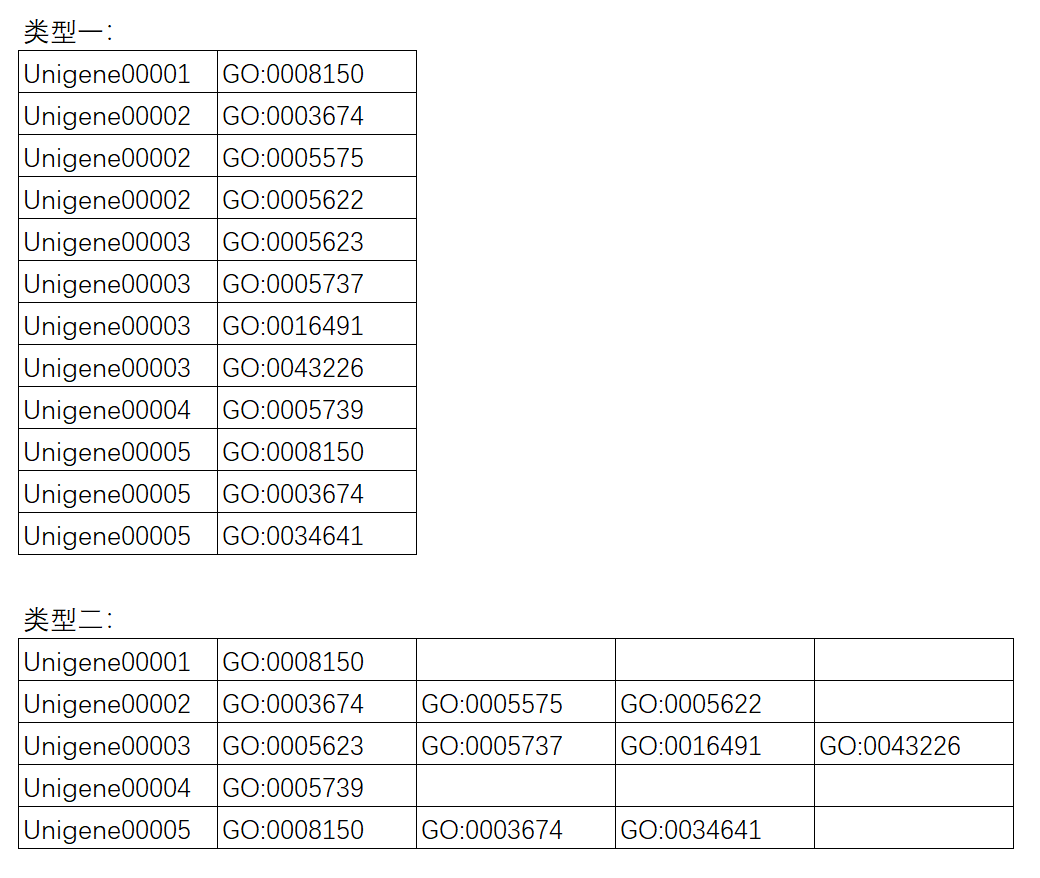
如果所研究物种不在以上范围,则需要自行准备GO背景基因文件。现在支持两种格式。第一种:格式为第一列为基因id,第二列为GO注释结果。第二种:同一个基因的所有GO号会在同一行并列给出。任务提交后,程序会自动判断处理。如下图所示:
参数:
① 选择p值或者q值作图:P-value/Q-value
② 选择前多少个通路作图:15/20/25/30
③ 输出图形选择:富集气泡图/富集条形图/富集圈图/z-score气泡图
输出:
① out.[PFC].html: 网页格式结果,3个分别对应GO的3个主要分类。
② out.[PFC].xls: 基因的GO功能分类统计结果。
③ out.[PFC].barplot/gradient.png/pdf:基因的GO功能分类结果统计图(气泡图/条形图/有向无环网络图)(png/pdf格式)。
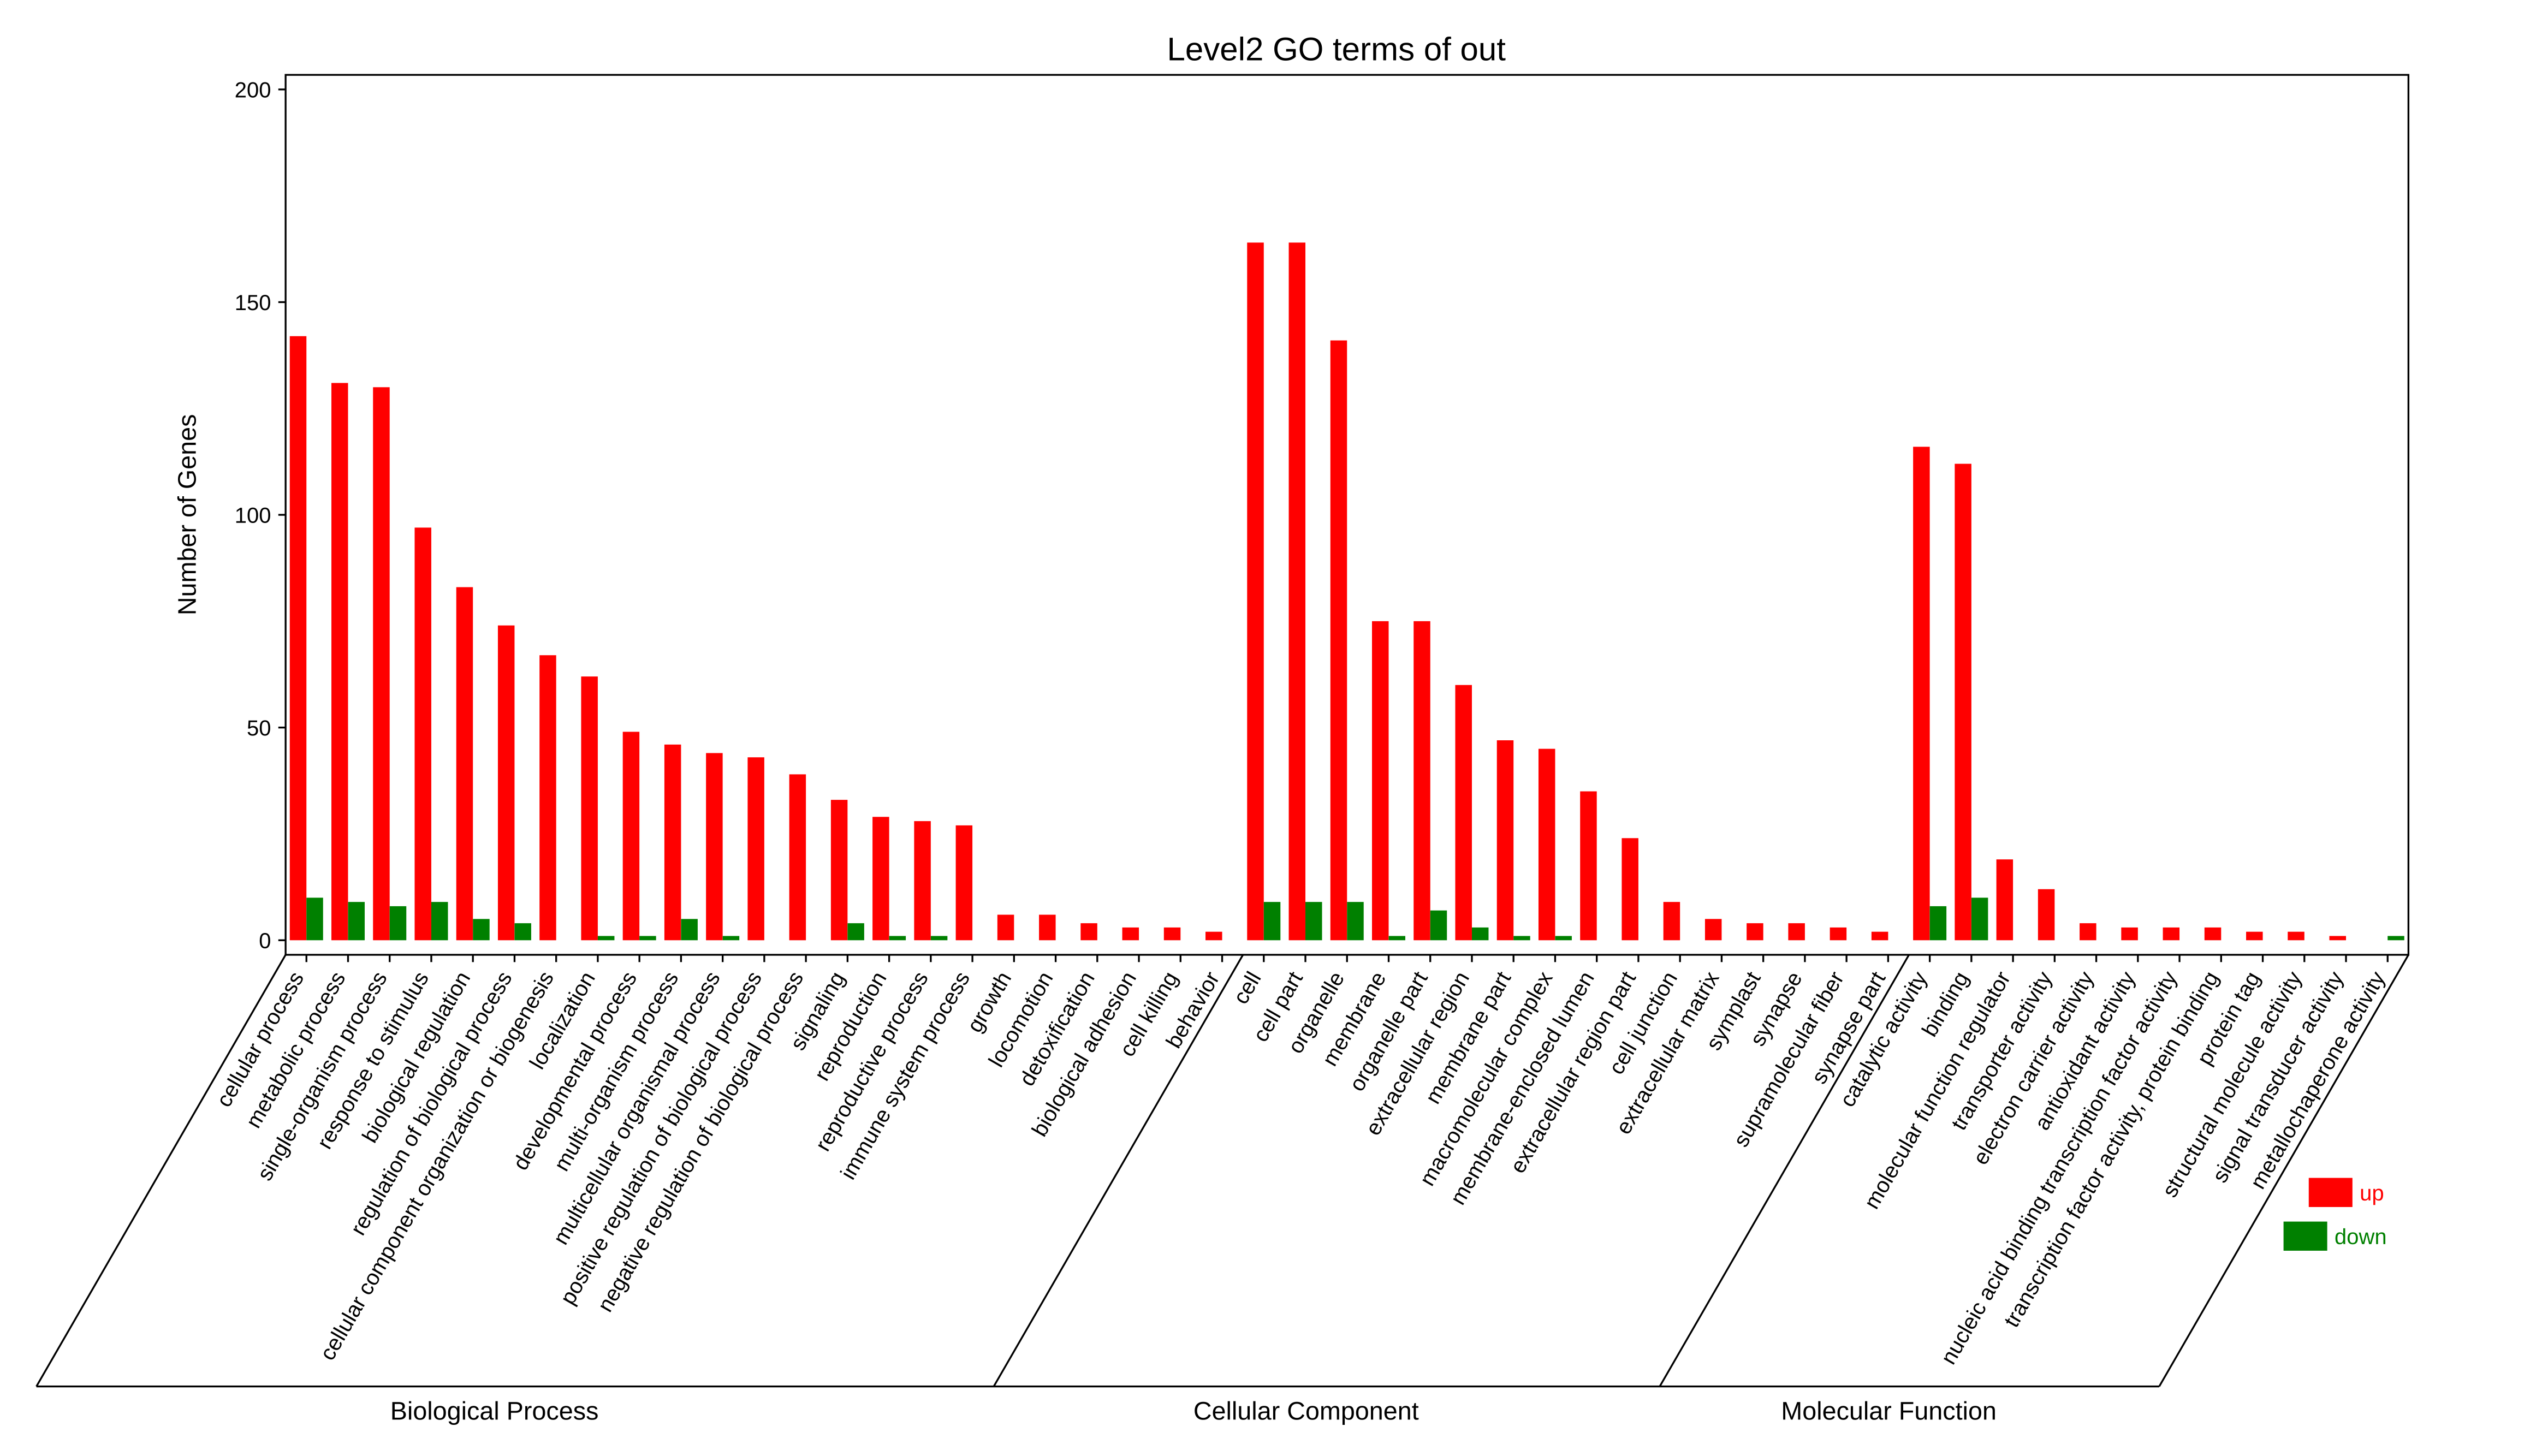
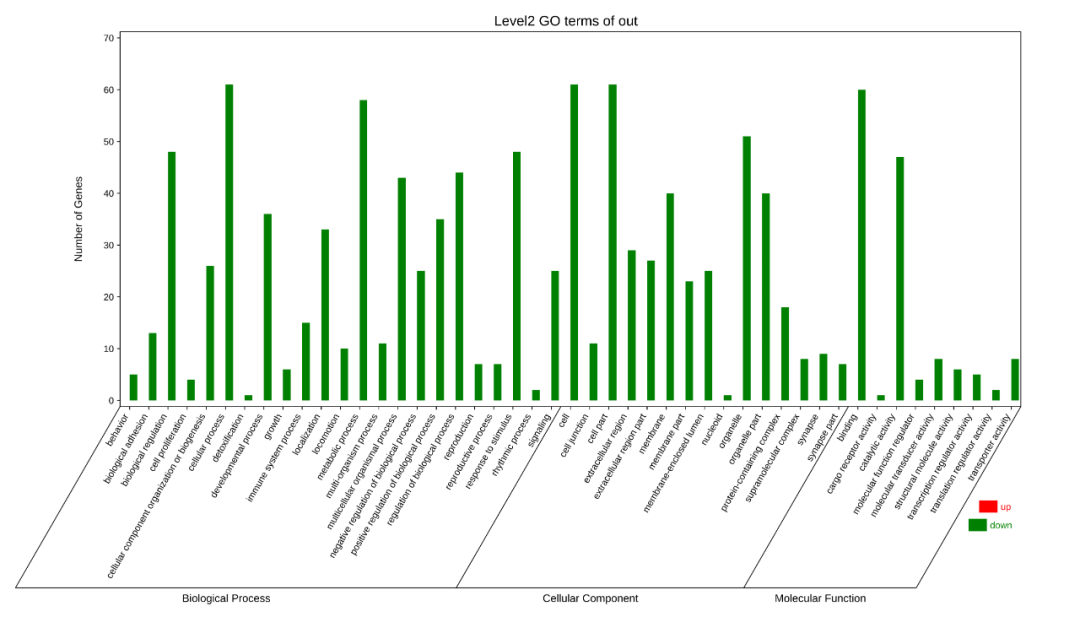
④ out.secLevel2.svg/png:为GO二级分类统计图,统计了用于富集的基因在GO 的二级分类中占各个分类的数量,统计结果在xls表中。表格内容包括,Ontology,Class(GO的二级分类),基因数,具体基因id。
⑤ out.level2.xls: GO第二级分类统计。
⑥ out.bubble/bubble_sp.png/pdf: 3个分类的z-score气泡图(png/pdf格式)(如果通路太多,则影响图形美观和整体布局,所以该图形默认使用前20个term绘图)。
⑦ out.circular.png/svg: 富集圈图(png/svg格式)(最多展示25个GO term,如果选择30个GO term,则输出结果还是25个GO term)。
富集分析图形解读及应用请点击该链接查看详情:
示例文件:目的基因(含差异倍数)
输入:
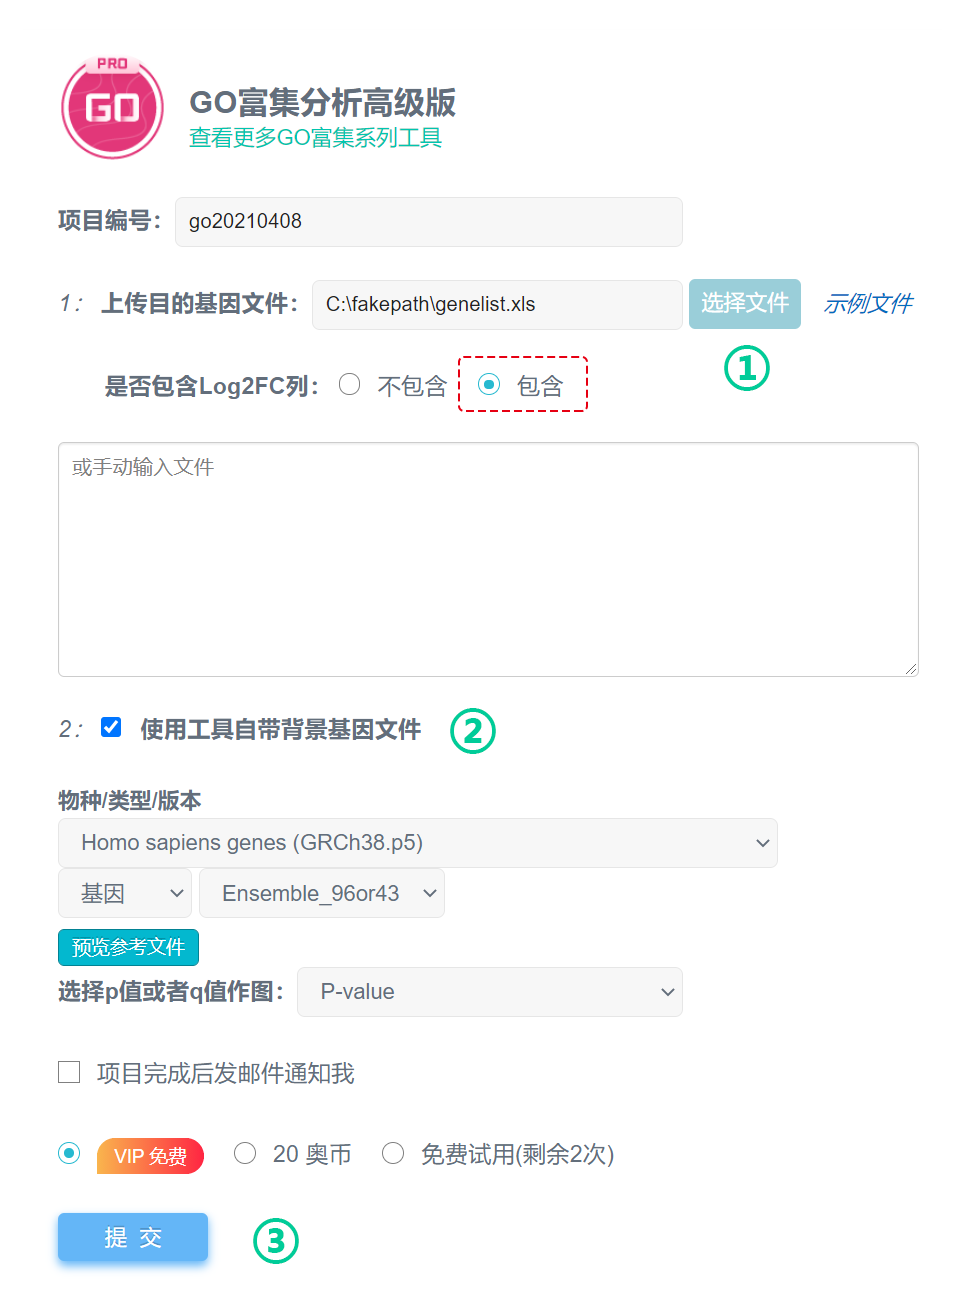
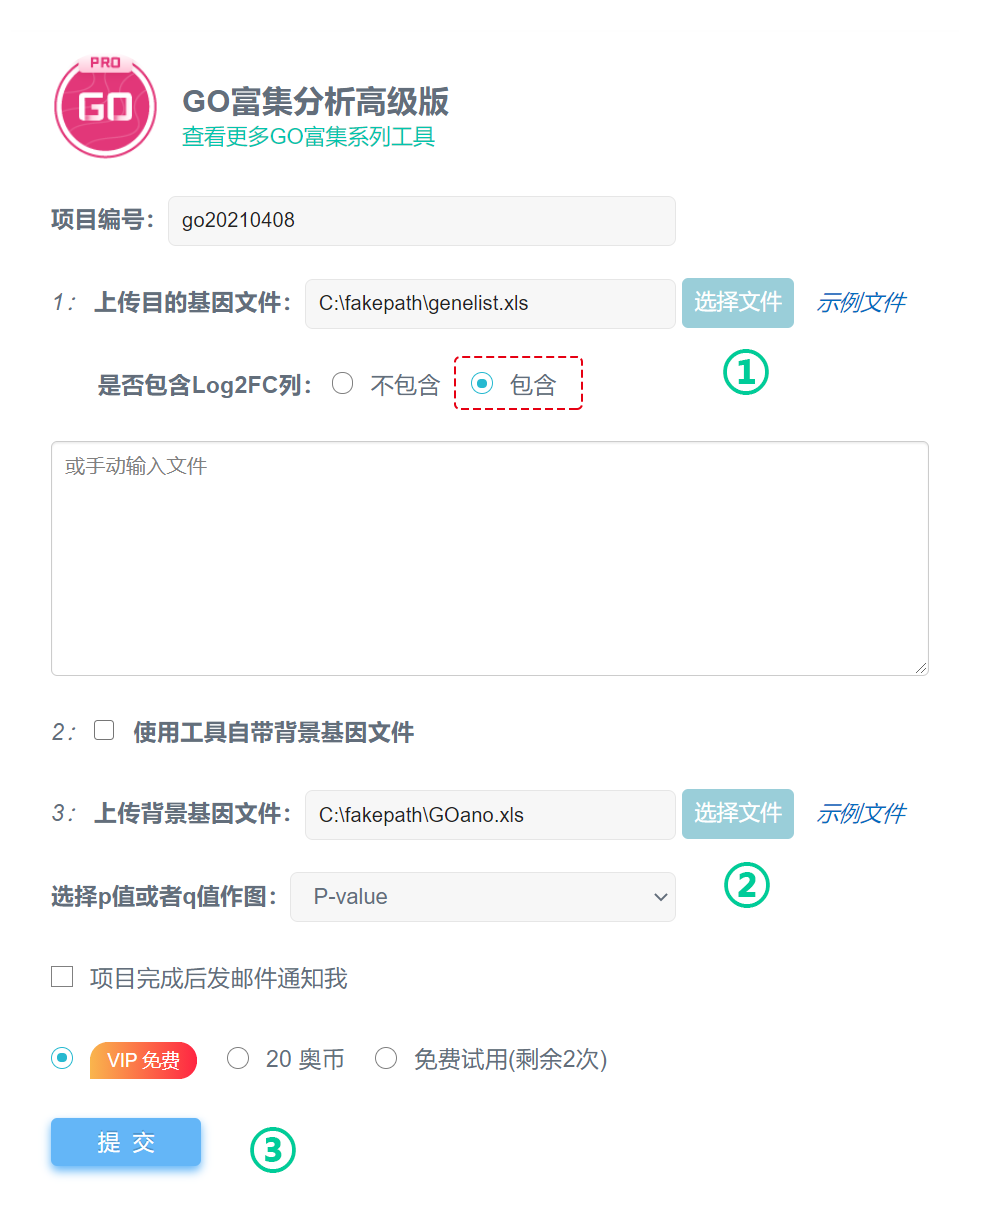
富集分析的步骤:
第1步:上传目的基因文件;
第2步:选择(或上传)背景基因文件;
第3步:提交。
方式一:使用工具自带的背景基因文件
方式二:使用自己准备的背景文件进行GO富集分析
输出:
① out.[PFC].html 网页格式结果,3个分别对应GO的3个主要分类。结果如下图所示, 包含两个部分:
第一部分为GO富集结果统计表,包括GOid,GO功能描述,基因比例,背景基因比例,P值,Q值,P值Q值 小于0.05的显示红色。

第二部分为GO富集的具体基因,点击GOid可以链接到http://amigo.geneontology.org 官网,可以查看GO的具体信息。

② out.[PFC].png,out.[PFC].pdf,out.[PFC].xls GO富集的富集气泡图、富集条形图、有向无环图,只显示富集的GO term(即p值小于0.05的),没有小于 0.05的结果时,则没有这些文件。可以在xls结果从查看,结果与网页结果对应,包括GOid,GO功能描述,基因比例,背景基因比例,P值,Q值,以及相应的基因id。
③ out.secLevel.svg/png 图片结果如下图所示,为GO二级分类统计图,统计了用于富集的基因在GO 的二级分类中占各个分类的数量,统计结果在xls表中。表格内容包括,Ontology,Class(GO的二级分类),基因数,具体基因id。
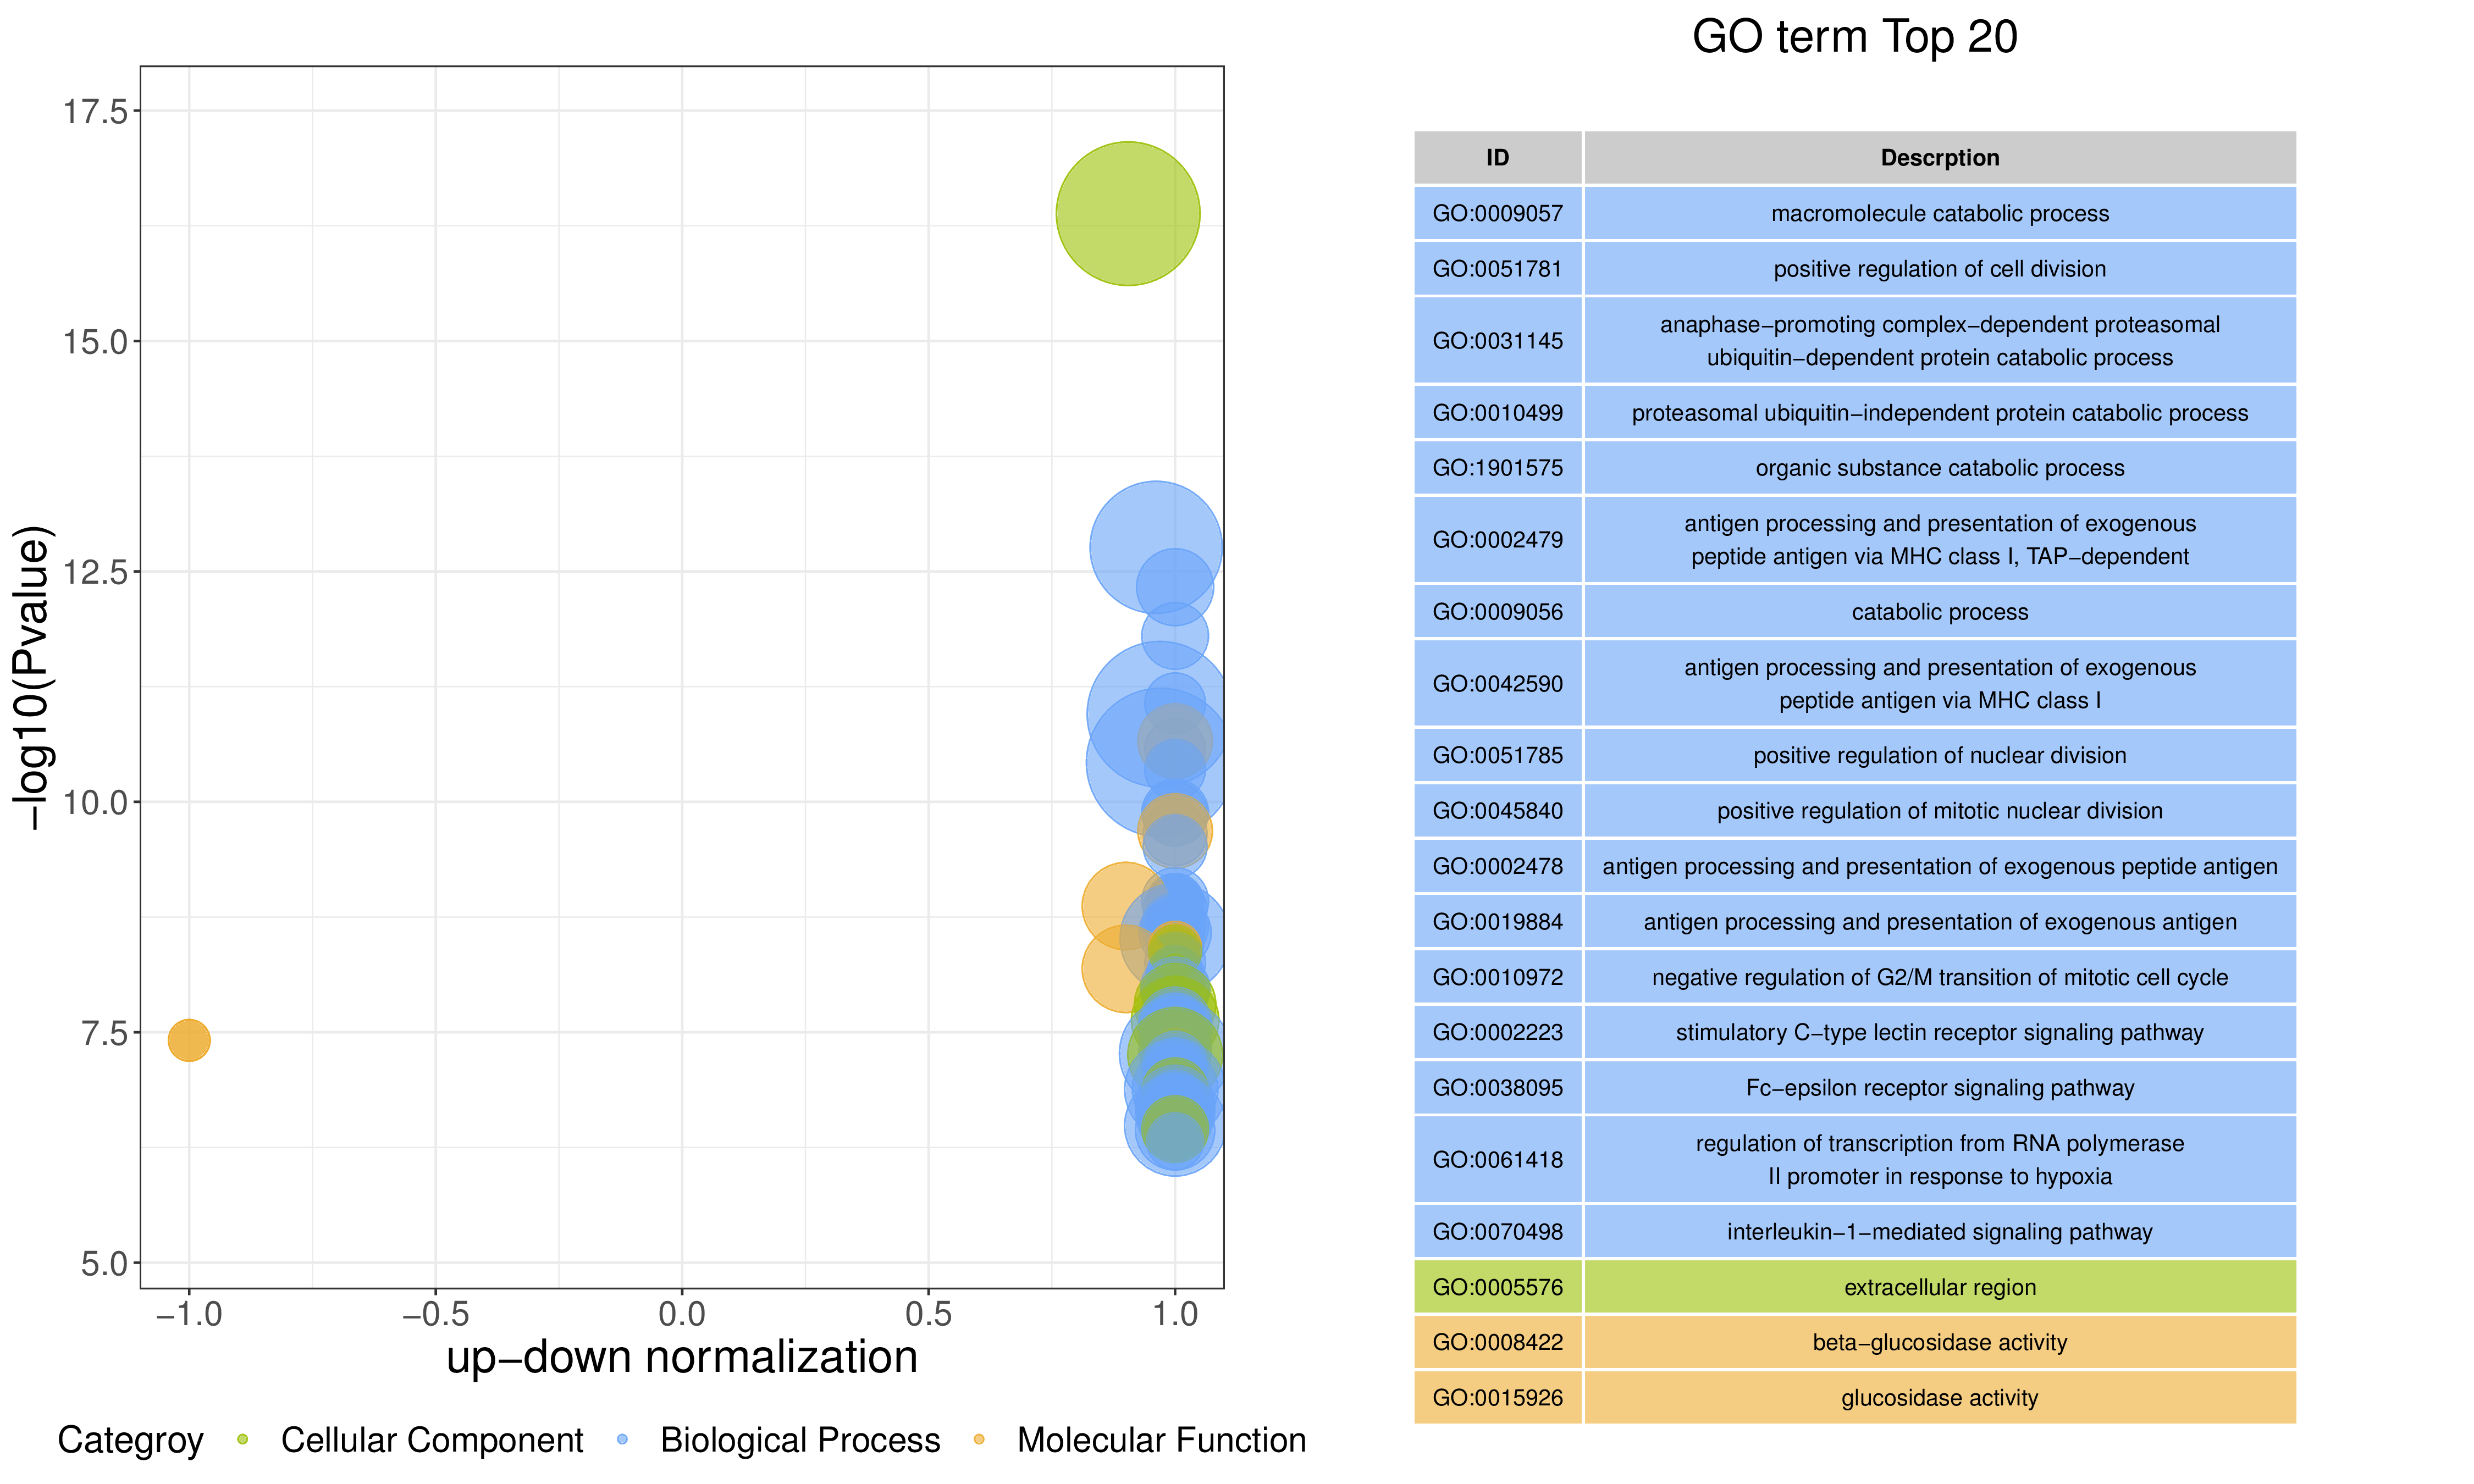
④ out.bubble/bubble_sp.png/pdf 图片结果如下图所示,为GO富集分析的z-score气泡图,纵坐标为-log10(Pvalue),横坐标为up-down normalization值(差异上调基因数目与差异下调基因数目的差值占总差异基因的比例),气泡大小表示当前GO term富集到的目的基因数;黄线代表Q/Pvalue=0.05的阈值;右边为Q/P值前20的term/Pathway列表,不同的颜色代表不同的Ontology/A class。
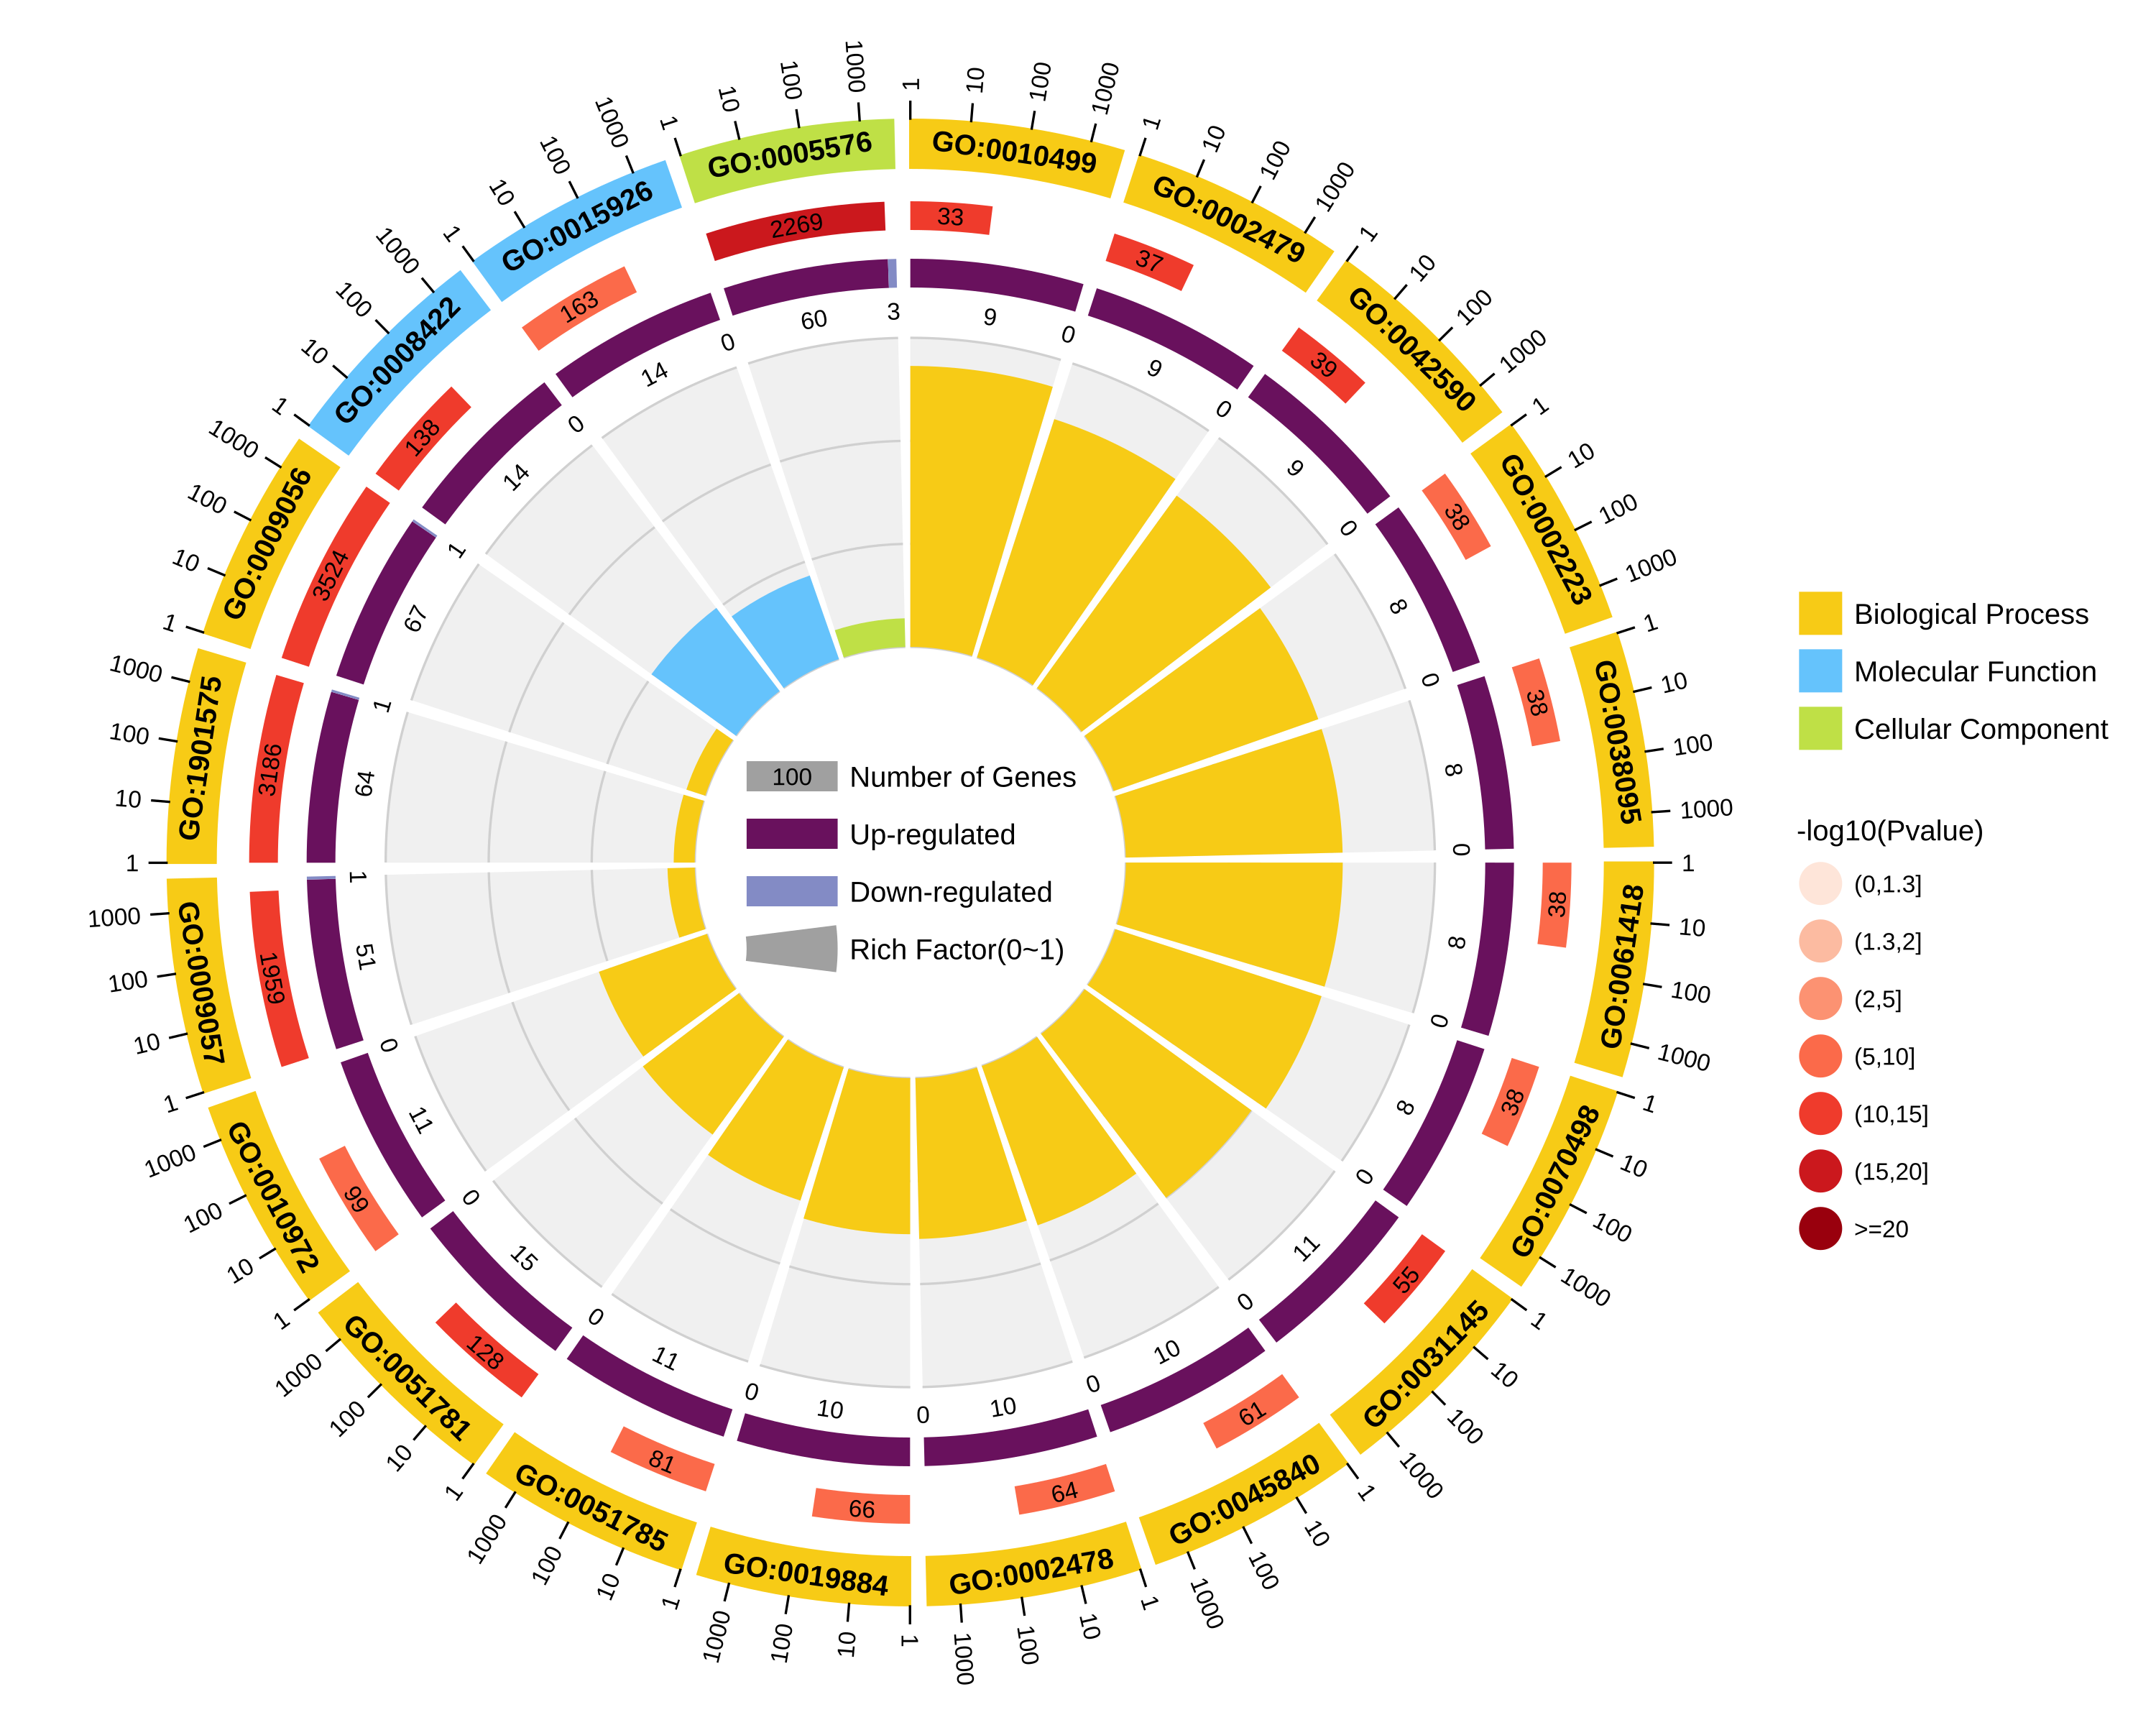
⑤ out.circular.png/svg 图片结果如下图所示,为GO富集分析的圈图,从外到内共四圈:
第一圈:富集的分类,圈外为基因数目的坐标尺。不同的颜色代表不同的分类;
第二圈:背景基因中该分类的数目以及Q值或P值。基因越多条形越长,值越小颜色越红;
第三圈:上下调基因比例条形图,深紫色代表上调基因比例,浅紫色代表下调基因比例;下方显示具体的数值;当输入的差异基因数量只有一列(未区分上下调)时,第三圈显示前景基因的总数目;
第四圈:各分类的RichFactor值(该分类中前景基因数量除以背景基因数量),背景辅助线每个小格表示0.1。
Q1. 为什么上传目的基因,选用平台背景基因却出错?
(1)先确认自己物种是否已经切换。
(2)点击“预览背景基因”,查看平台提供的基因跟目的基因类型是否相同。
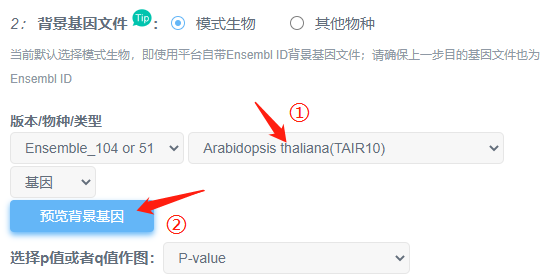
①平台提供的是Ensembl ID,但是目的基因表是symbol或其他id类型,则需要对目的基因进行基因ID转换;
②Ensembl id的结构是“物种前缀+序列类型+数字”Ensembl ID 后面的”小数”部分为版本号,如ENSG00000121410.11,小数部分的版本号必须删除。
Q2.怎么将基因转换成跟背景基因适配的类型呢?
①如果是上述18种常见物种,且手头上的基因类型是Gene_stable_ID/ Gene_name/NCBI_gene_ID/Gene_Synonym,那么可以使用“基因ID转换”(点击跳转)工具直接进行转换。
②如果不是上述物种或类型,可以通过BioMart等网址进行转换,相关教程在OmicShare论坛有很多,点击跳转相关教程。
【关于结果的常见问题】
Q3.结果文件中的P/F/C是什么意思?
分别对应BP/MF/CC。
GO总共有三个ontology(本体),分别描述基因的分子功能(molecular function)、细胞组分(cellular component)、参与的生物过程(biological process)
Q4.为什么二级分类统计图没有上下调基因统计?
文件中没有log2FC或者文件中有数据但上传时没有勾选“包含”log2FC列。
Q5.为什么结果中 p value 全为1:
pvalue全为1,基本是目的基因数目与背景基因数目完全一样所致。注意,富集分析中的背景基因是当前物种所有基因的列表。
Q6.为什么二级分类统计图不是按照Gene number排序?
上传时,文件没有log2FC但勾选了“包含”,会导致出图时候基因数目没有按照降序排序,如下图。
Q7.为什么统计结果会比我上传的目的基因数目多?
由于一个基因常常对应多个GO term,因此同一个基因会在不同分类条目下出现,即被多次统计,因此如果把二级分类统计图所有柱子的基因数目加起来,肯定是多于profiel1总的基因数目的。
引用OmicShare Tools的参考文献为:
Mu, Hongyan, Jianzhou Chen, Wenjie Huang, Gui Huang, Meiying Deng, Shimiao Hong, Peng Ai, Chuan Gao, and Huangkai Zhou. 2024. “OmicShare tools: a Zero‐Code Interactive Online Platform for Biological Data Analysis and Visualization.” iMeta e228. https://doi.org/10.1002/imt2.228案例1:
发表期刊:Signal Transduction and Targeted Therapy
影响因子:39.3
发表时间:2022
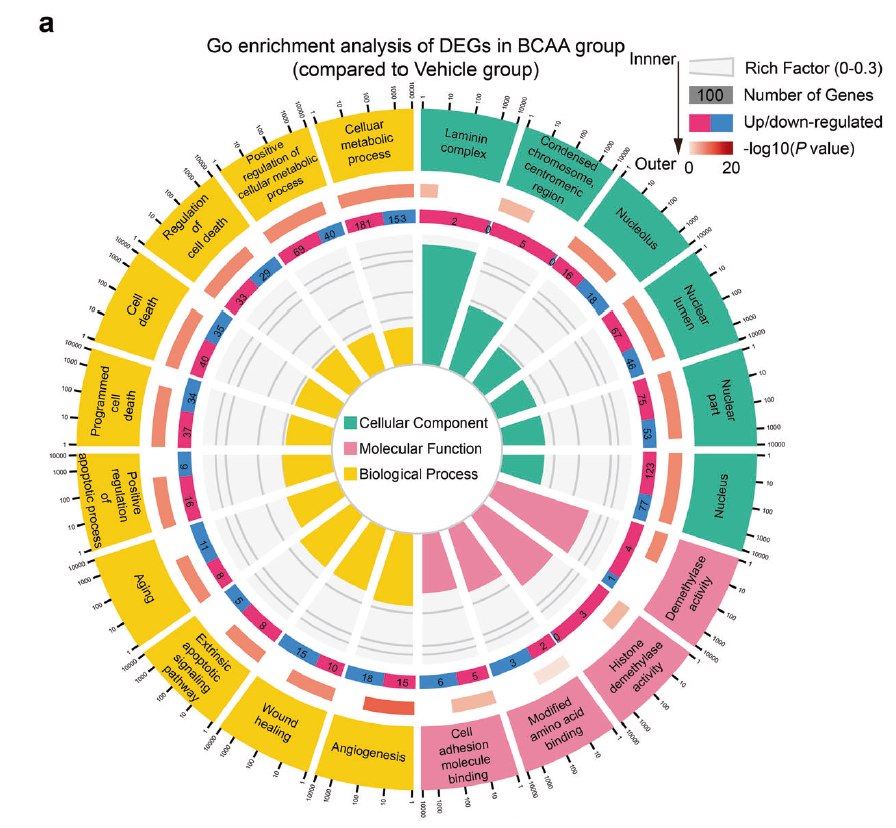
Fig. 3 BCAA accelerated H3K9me3 loss in ADSCs upon exposure to detrimental stress. a GO enrichment of the DEGs in ADSCs treated with vehicle or BCAA (3.432 mM) under hydrogen peroxide (100 μM) stress as identified by RNA-seq. Twenty significantly enriched GO terms are shown.
引用方式:
Gene Ontology (GO) enrichment analysis was performed and the results visualized with the
OmicShare tool, an online platform for data analysis (https://www.omicshare.com/tools/Home/Soft/enrich_circle).
参考文献:
Zhang F, Hu G, Chen X, et al. Excessive branched-chain amino acid accumulation restricts mesenchymal stem cell-based therapy efficacy in myocardial infarction[J]. Signal Transduction and Targeted Therapy, 2022, 7(1): 171-171.
案例2:
发表期刊:Nutrients
影响因子:5.9
发表时间:2022
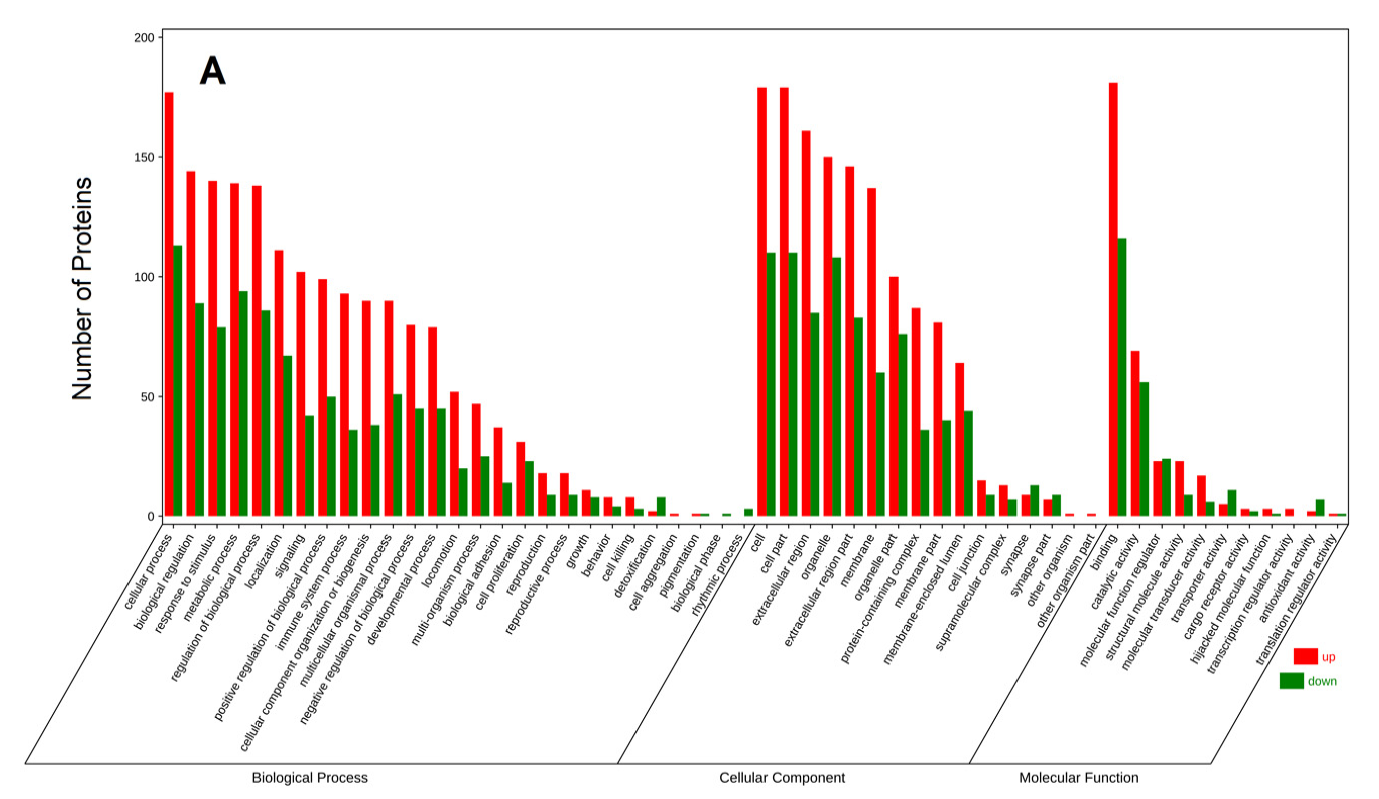
Figure 4. GO annotation of differentially expressed proteins in C vs. M(A)
引用方式:Omicshare online software was used for gene ontology (GO) annotation to analyze the annotation function of milk protein. Pathway analysis of the identified milk proteins was performed based on the online Omicshare software using the Kyoto Encyclopedia of Genes and Genomes (KEGG) pathway database.
参考文献:
Zhang Y, Zhang X, Mi L, et al. Comparative proteomic analysis of proteins in breast milk during different lactation periods[J]. Nutrients, 2022, 14(17): 3648.
案例3:
发表期刊:International Journal of Biological Macromolecules
影响因子:8.2
发表时间:2023
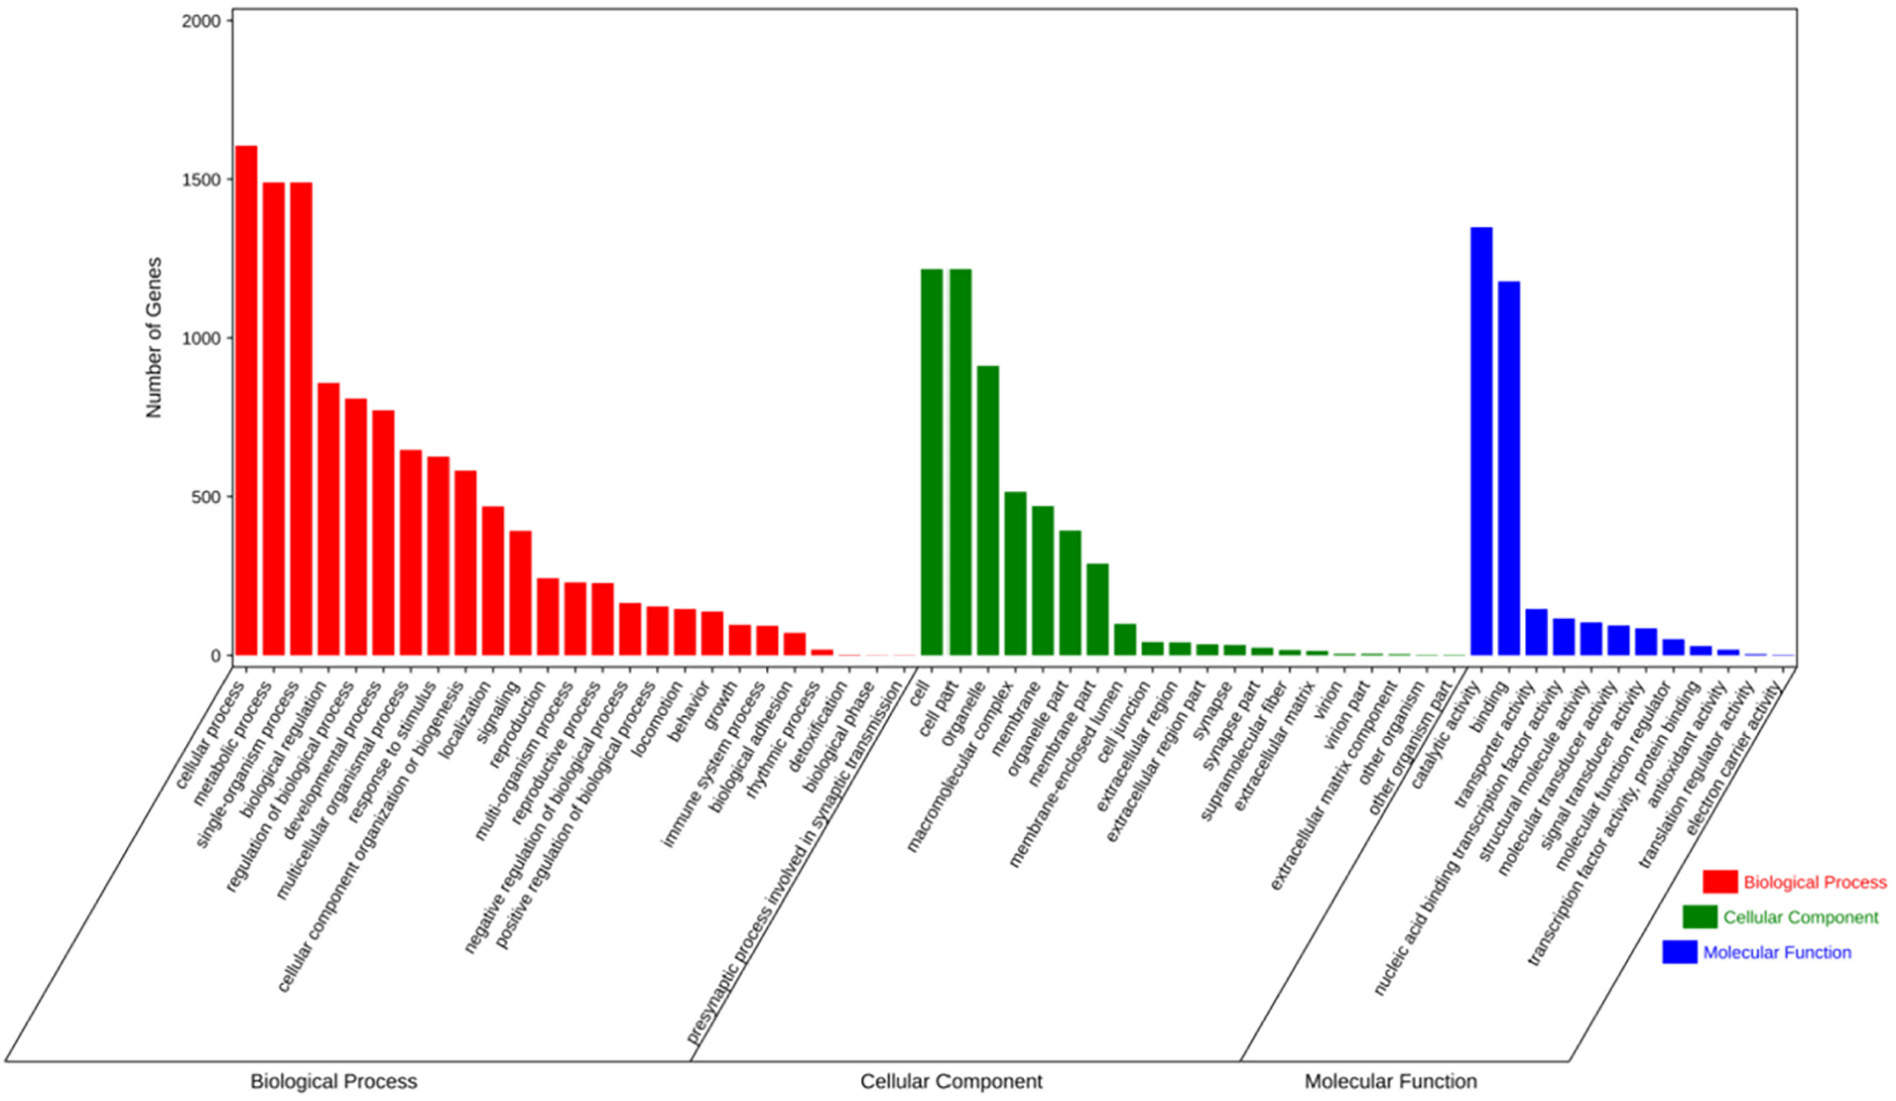
Fig. 2. GO enrichment analysis of G4 containing genes. The genes whose contained G4 were selected to do enrichment tests in order to reveal the enrichment of gene ontology terms. Statistically significant molecular functions, biological processes, and cellular component were identified. Each color block represents the gene amount in each tissue.
引用方式:To understand the potential functions of genes with G4, we performed Gene Ontology (GO) term annotation using OmicShare tools (https://www.omicshare.com/tools).
参考文献:
Deng Z, Ren Y, Guo L, et al. Genome-wide analysis of G-quadruplex in Spodoptera frugiperda[J]. International Journal of Biological Macromolecules, 2023, 226: 840-852.
案例4:
发表期刊:International Journal of Biological Macromolecules
影响因子:8.2
发表时间:2023
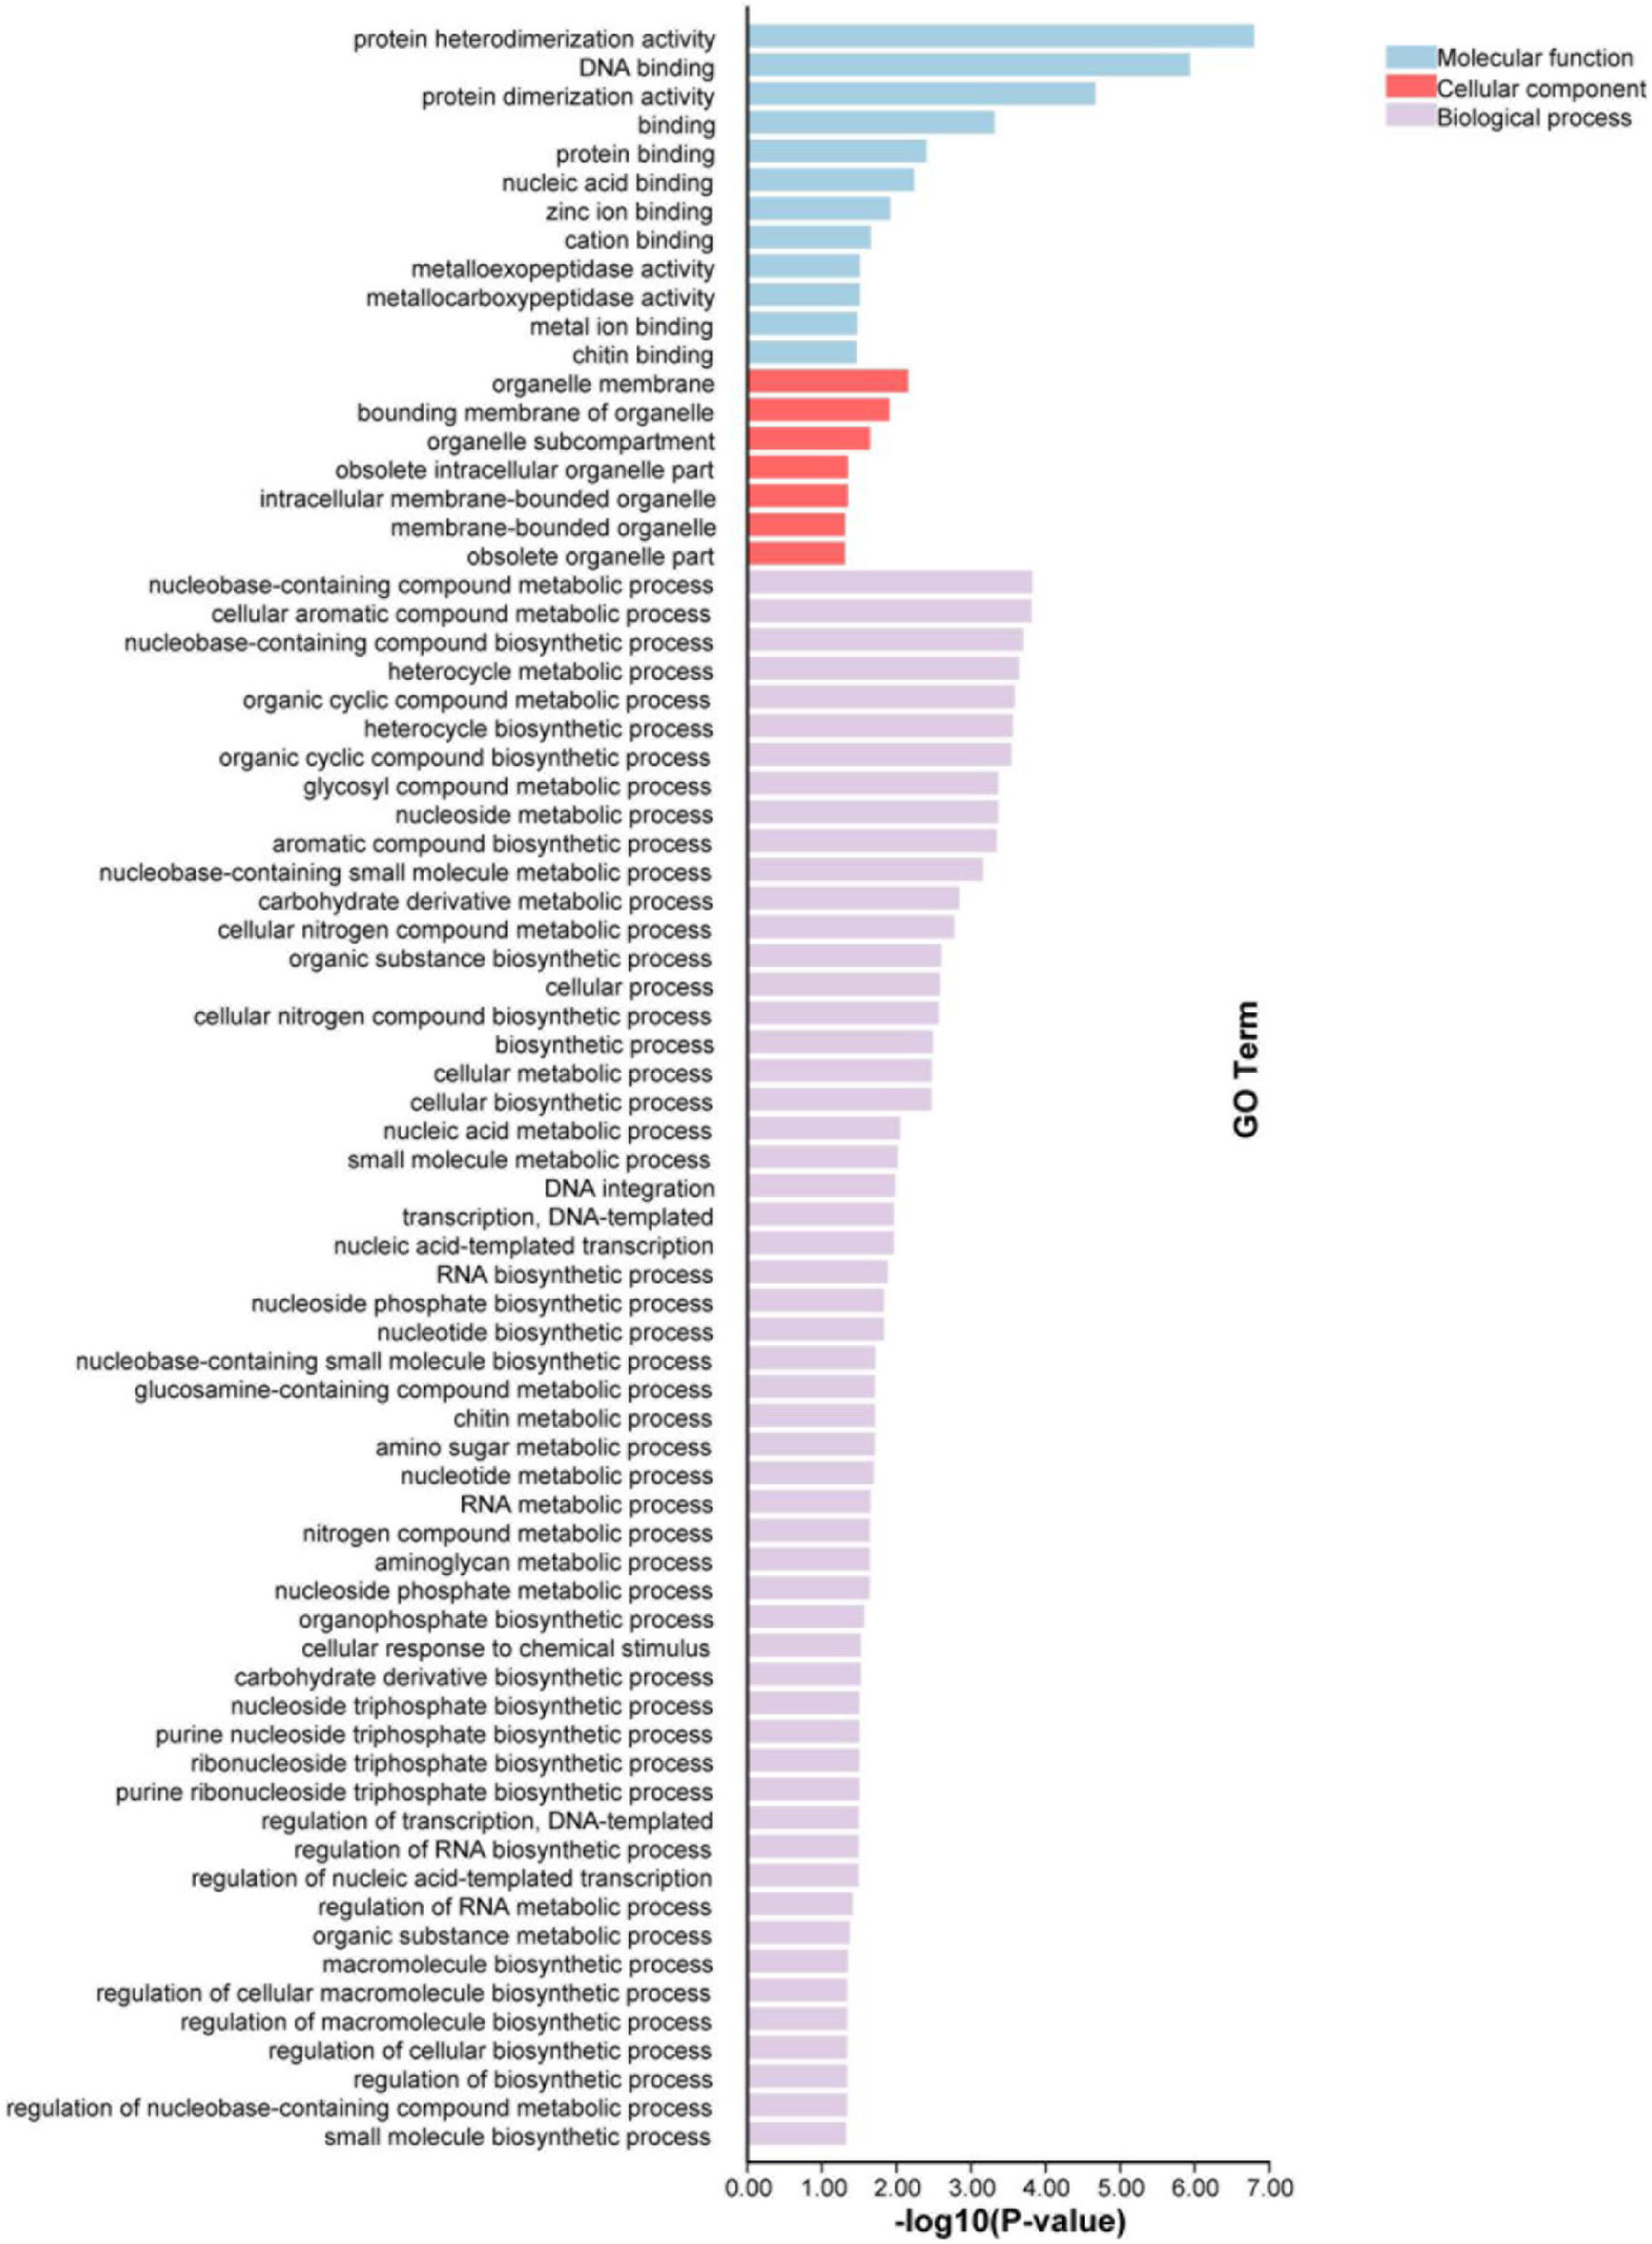
Fig. 4. GO enrichment analysis of G4-rich promoters in S. frugiperda. The genes whose promoters enriched G4 were selected to do enrichment tests in order to reveal the enrichment of gene ontology terms. Statistically significant molecular functions, cellular component and biological process were identified. Each color block represents the gene amount in each tissue.
引用方式:To understand the potential functions of genes with G4, we performed Gene Ontology (GO) term annotation using OmicShare tools (https://www.omicshare.com/tools).
参考文献:
Deng Z, Ren Y, Guo L, et al. Genome-wide analysis of G-quadruplex in Spodoptera frugiperda[J]. International Journal of Biological Macromolecules, 2023, 226: 840-852.
案例5:
发表期刊:Journal of Ethnopharmacology
影响因子:5.4
发表时间:2023
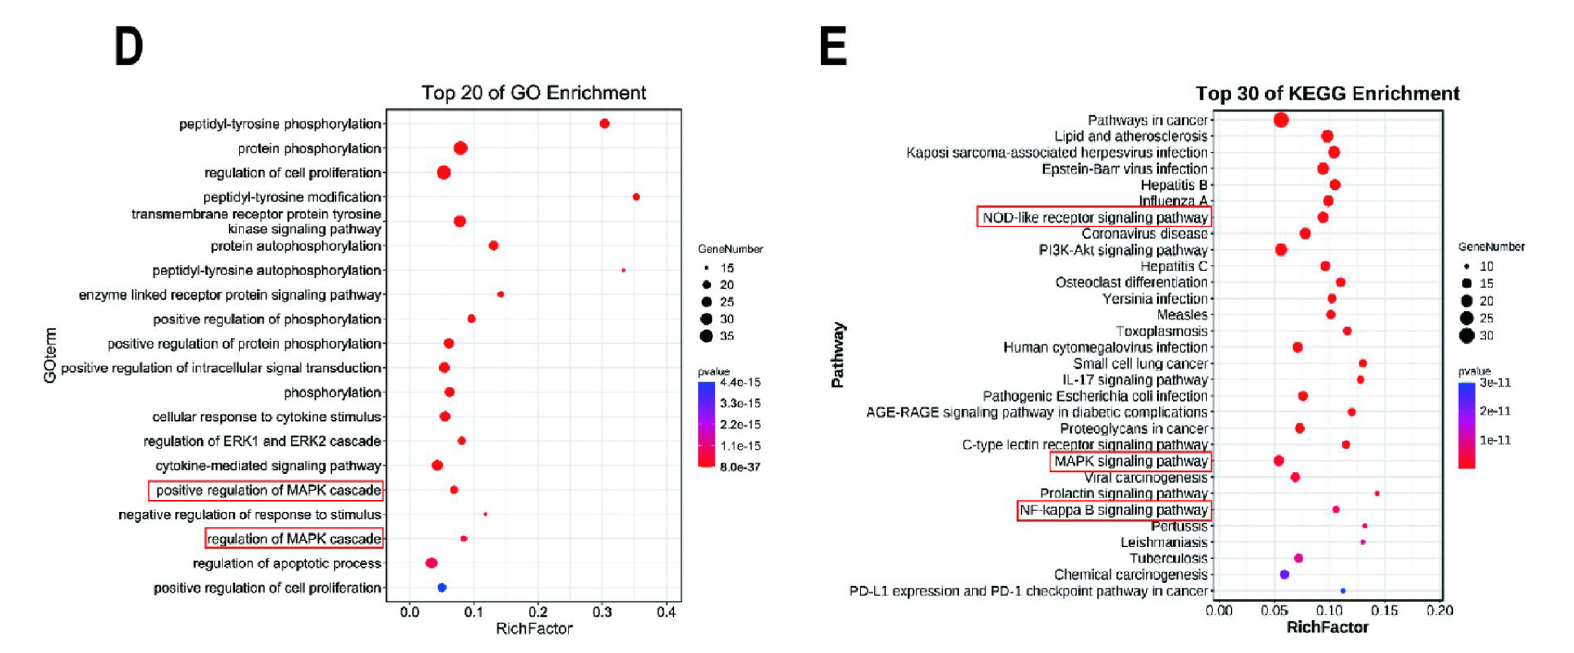
Fig. 2. Network pharmacology predicts the anti-gout mechanism of WWSX. (D) Graph of GO bioprocess enrichment analysis. (E) KEGG mechanism of action enrichment analysis map. (For interpretation of the references to colour in this figure legend, the reader is referred to the Web version of this article.)
引用方式:The GO biological process, cellular analysis, molecular function and KEGG pathway bubble map of core targets were constructed on the OmicShare platform, combined with GO and KEGG improvement investigation, the key targets and their biological forms of the organize may well be anticipated.
参考文献:
Bai L, Wu C, Lei S, et al. Potential anti-gout properties of Wuwei Shexiang pills based on network pharmacology and pharmacological verification[J]. Journal of Ethnopharmacology, 2023, 305: 116147.
案例6:
发表期刊:EBioMedicine
影响因子:11.1
发表时间:2022
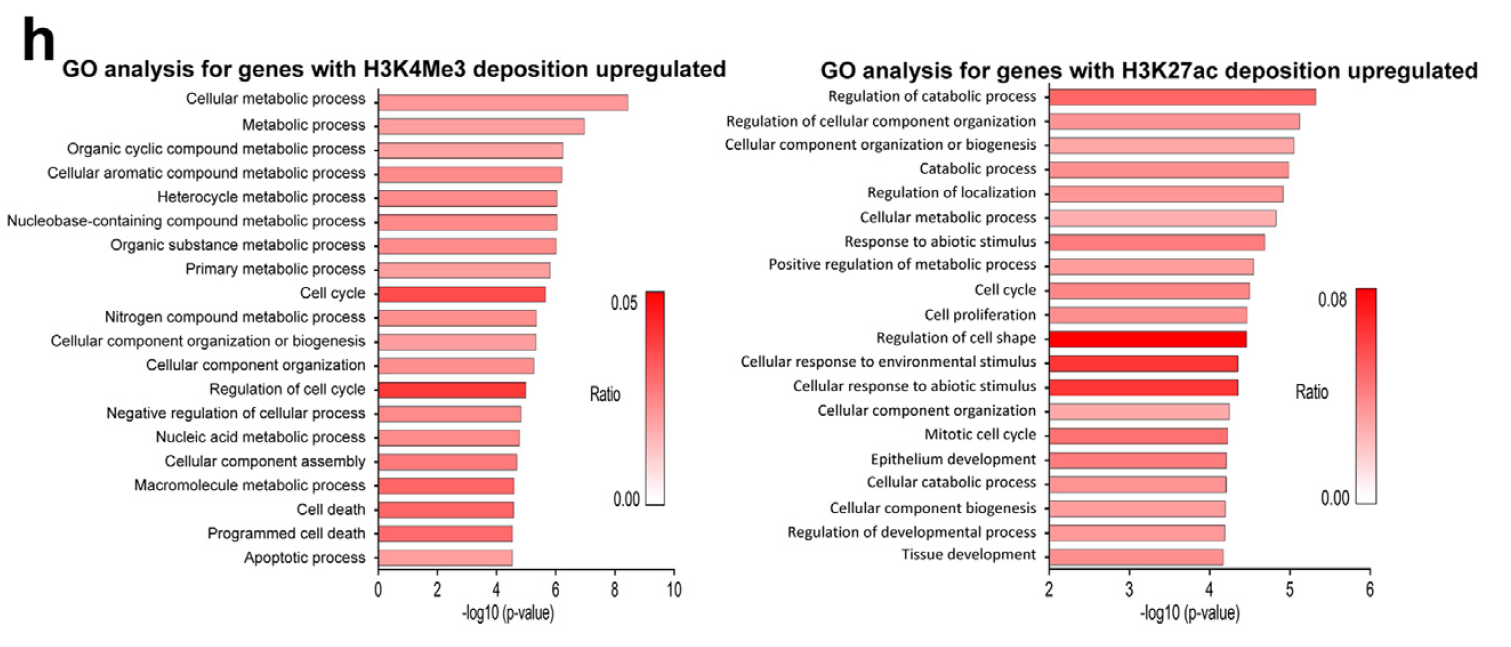
Figure 3. DYRK1A knockdown increases deposition of H3K27ac and H3K4me3 on promoters of cell cycle genes in cardiomyocytes. (h) GO analysis for genes with increased H3K4me3 (left) and H3K27ac (right) deposition on promoter in si-DYRK1A-treated cardiomyocytes.
引用方式:Heatmaps of gene expression, gene ontology (GO) and Kyoto encyclopedia of genes and genomes (KEGG) pathway analyses were performed using the OmicShare tools, a free online platform for data analysis (http://www.omicshare.com/tools).
参考文献:
Lan C, Chen C, Qu S, et al. Inhibition of DYRK1A, via histone modification, promotes cardiomyocyte cell cycle activation and cardiac repair after myocardial infarction[J]. EBioMedicine, 2022, 82.
案例7:
发表期刊:International Journal of Molecular Sciences
影响因子:5.6
发表时间:2023
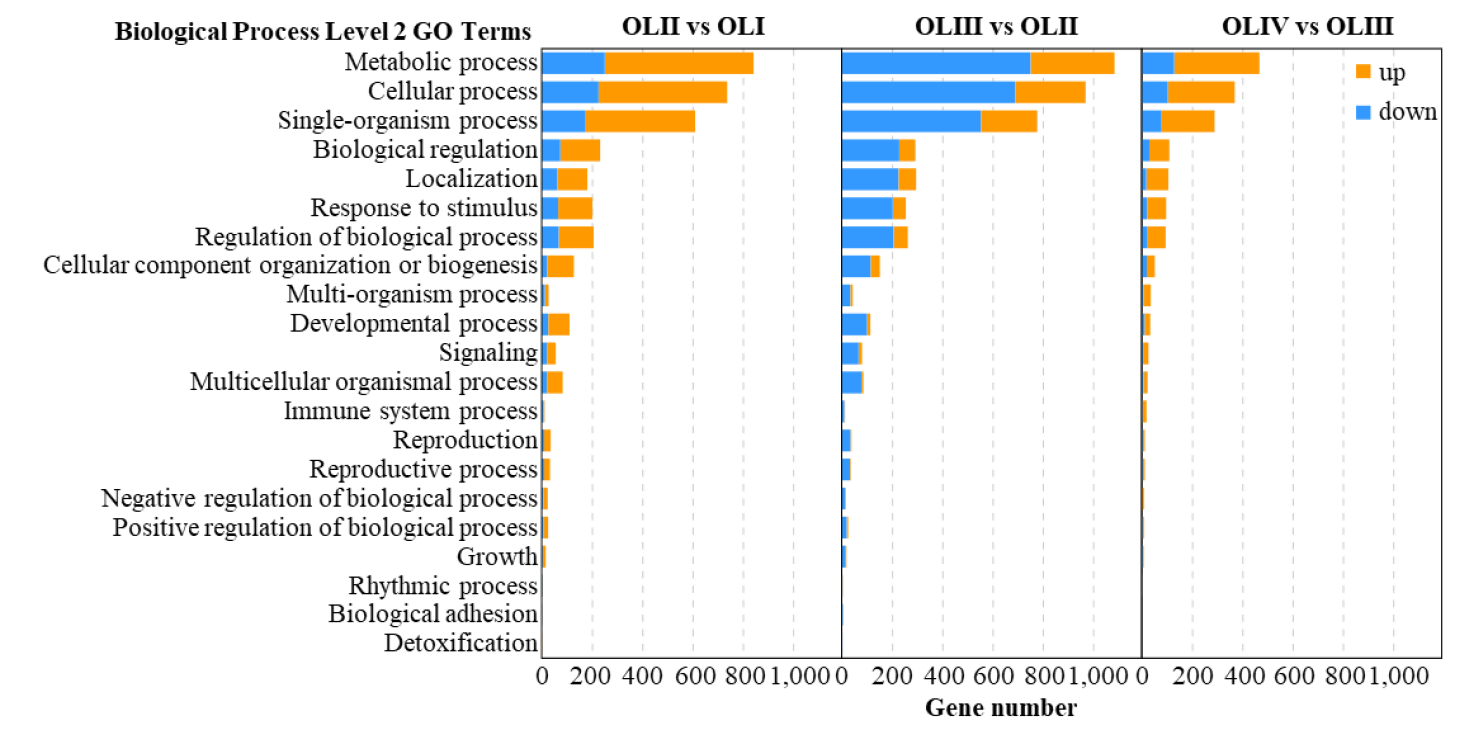
Figure 3. GO functional of the significantly differentially expressed genes of old leaves in diverse pairwise comparisons.
引用方式:GO and KEGG enrichment analyses of DEGs were performed using OmicShare tools in 2021, a free online platform for data analysis (http://www.omicshare.com/tools, 16 August 2022).
参考文献:
Guo H, Zhong Q, Tian F, et al. Transcriptome analysis reveals putative induction of floral initiation by old leaves in tea-oil tree (Camellia oleifera ‘changlin53’)[J]. International Journal of Molecular Sciences, 2022, 23(21): 13021.
案例8:
发表期刊:Precision Medicine Research
发表时间:2022
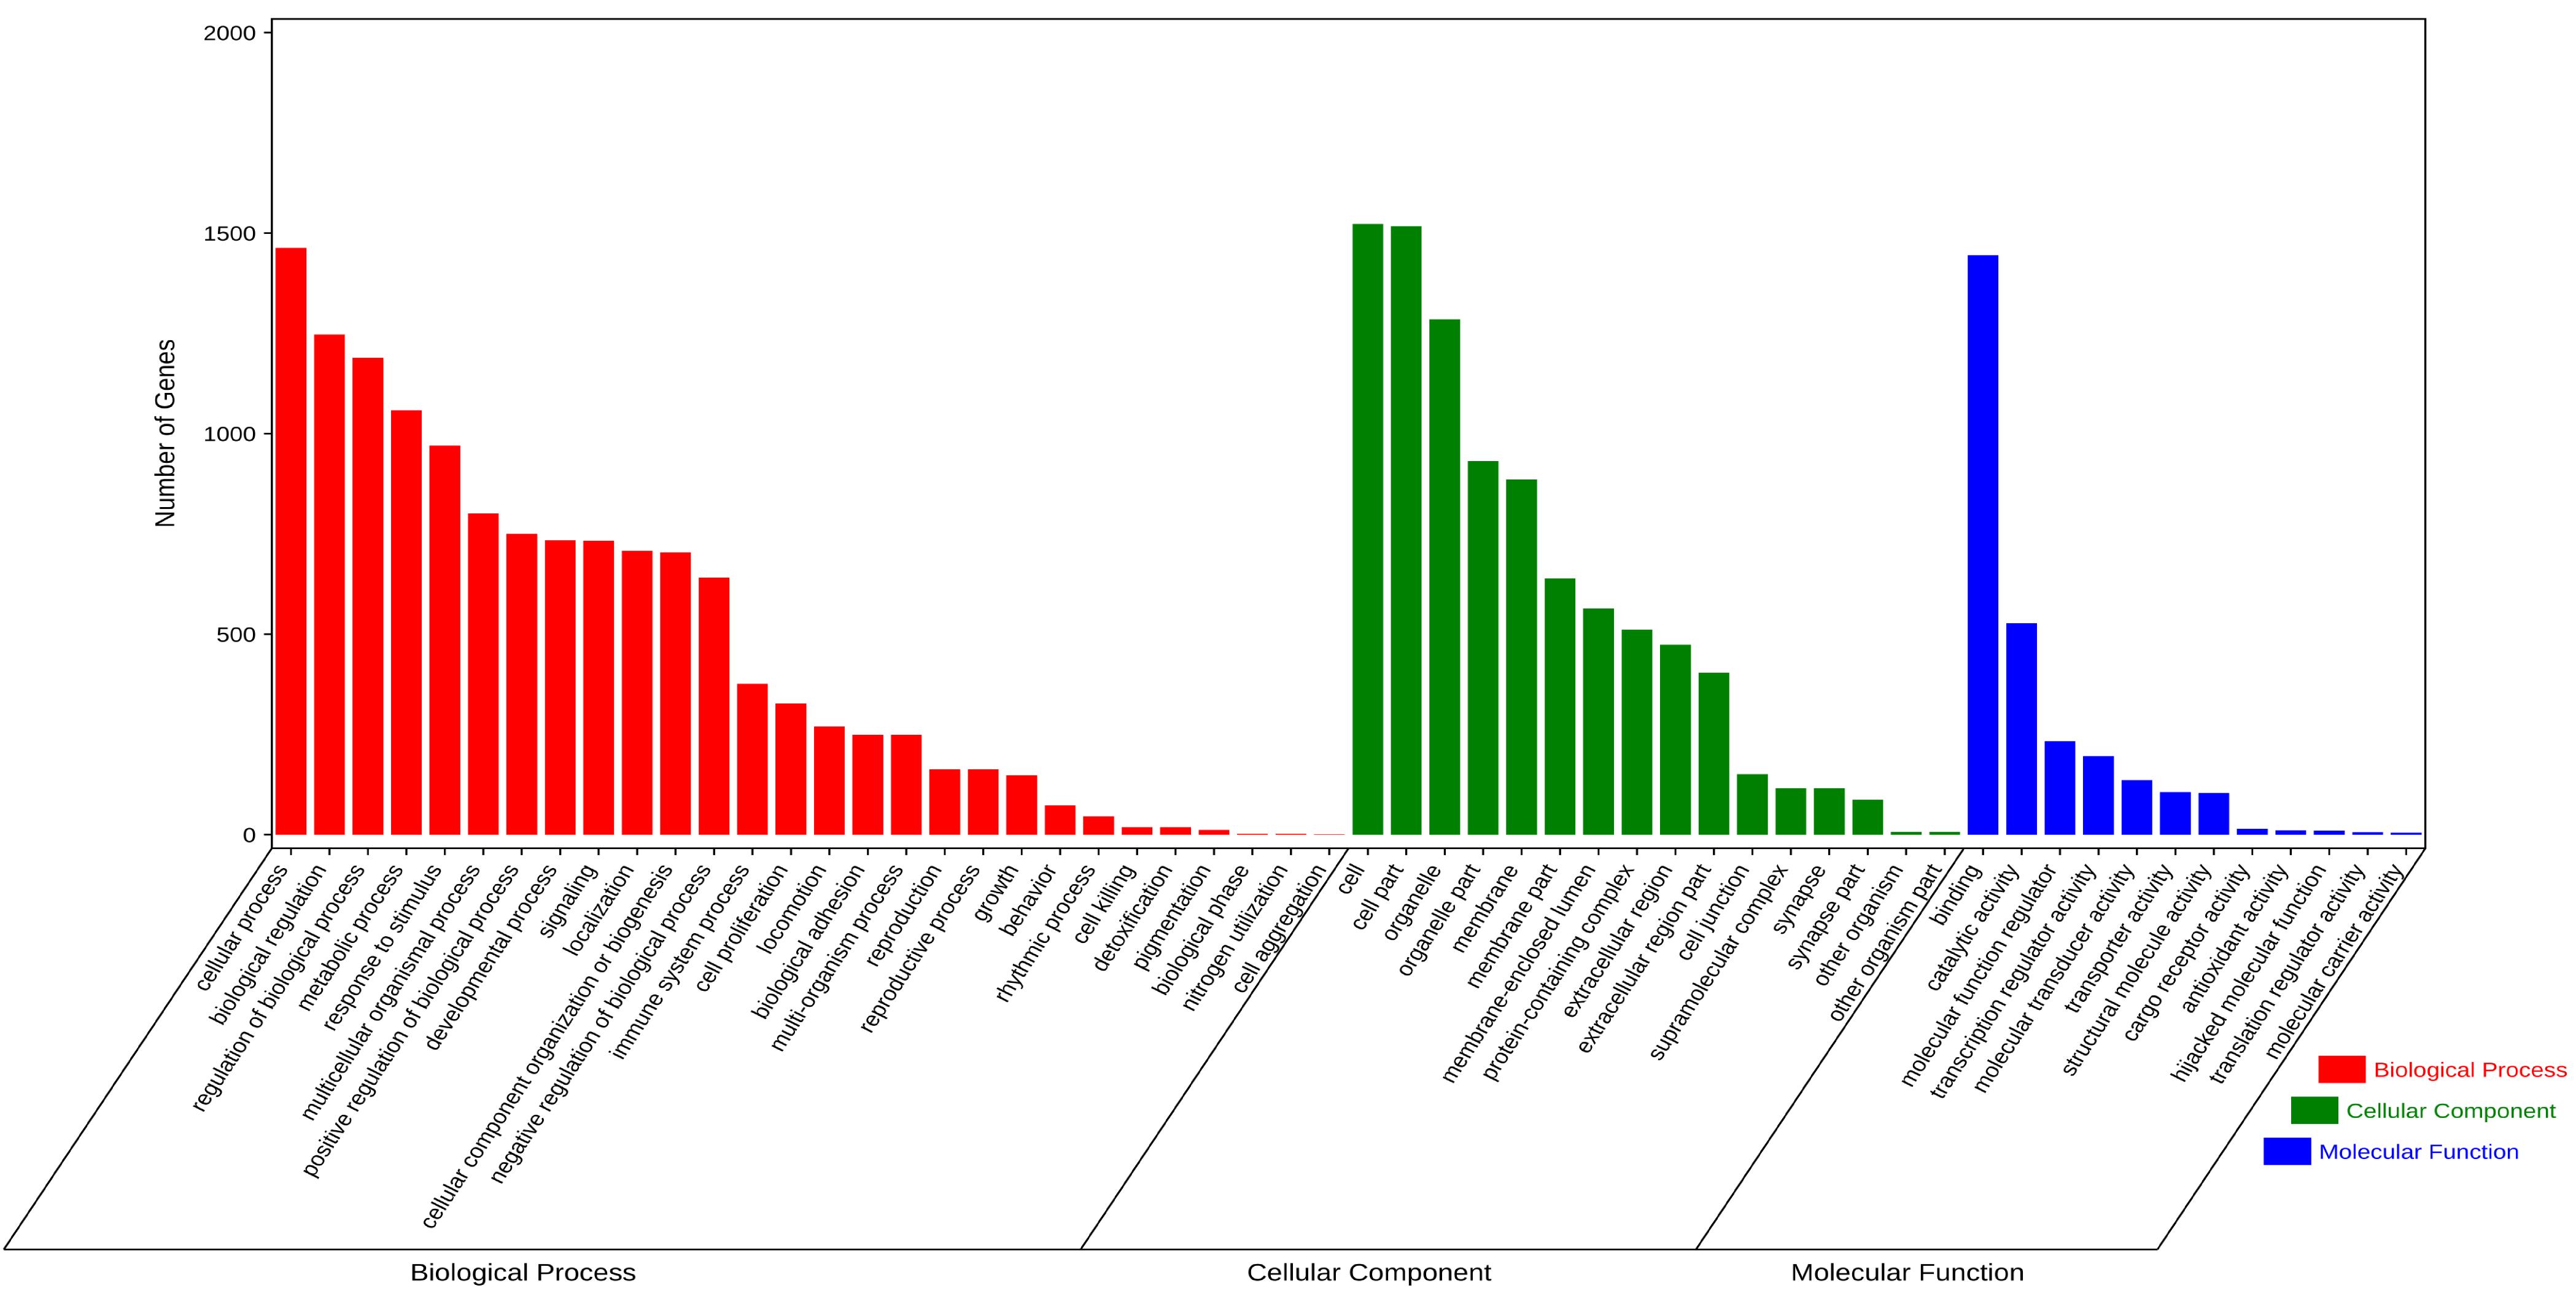
Figure 4. GO analysis of the overlapping DEGs between HCC and BC.
引用方式:The OmicShare database (https://www.omicshare.com/) was used for the visual analysis of KEGG and GO for enrichment analysis. Consequently, we selected the KEGG pathway analysis through the OmicShare database to execute functional annotation on HCC and BC overlapping DEGs.
参考文献:
Xie Z F, Li G G. Identification of overlapping differentially expressed genes in hepatocellular carcinoma, breast cancer, and depression by bioinformatics analysis[J]. Precis Med Res, 2022, 4(3): 11.


 扫码支付更轻松
