


 扫码支付更轻松

阈值筛选:
图形修改
1. 功能
韦恩图(Venn diagram)用于展示数据集之间的交集情况,在韦恩图中一般以椭圆、正圆等图形代表不同的数据集,以圆圈之间的重叠区域代表数据集之间的交集情况。本工具支持通过筛选后的元素数据文件或筛选前的丰度数据文件绘制韦恩图,并提取子集的元素信息。
当输入数据的组别数量≥6时,会自动绘制花瓣韦恩图。2-7组韦恩图绘制样式如下:

以上图YF和YC两个样本的韦恩图(第1个)为例,只需上传包含这列数据的OTU丰度表格,将OTU丰度的阈值设为>0,即可查看这两个样本独有和共有的OTUs。注意,这里将图形的描边粗细设为3,颜色为白。
2. 输入文件
动态韦恩图工具支持两种类型的数据:
2.1 元素数据文件
元素数据文件中,每一列表示一个组,每一个单元格中的文本表示当前分组中的一个元素(如差异基因),列名为组名,每个组的元素数量一般不相同,如下图。

2.2 丰度数据文件
丰度数据文件中,表格的第一列为元素名称(如基因id、OTU id等),之后的列表示该元素在不同分组的丰度值(数值),列名为分组名称,如下图。

当选择上传“丰度数据文件”时,可通过指定阈值的方式筛选每个样本(分组)符合条件的元素(比如筛选样本中tags数值大于0的OTU),然后使用图形展示不同样本(分组)之间这些元素的共有关系。
与选择上传“元素数据文件”相比,我们只需上传包含不同样本基因、蛋白、代谢物、物种OTU等的表达量(或丰度)表格,或者是包含不同比较组的差异倍数、显著性P值表格,无需在作图前自己筛选每个分组中符合条件的元素。
3. 结果输出
生成动态韦恩图,可通过设置选项对图形进行个性化调整,比如修改韦恩图的配色方案、描边粗细、查看下载子集元素信息等。

此外,当选择上传“丰度数据文件”时,我们也可以随时更改阈值,重新绘图。比如,可以将丰度大于0的OTU或差异倍数大于2的基因筛选出来绘制韦恩图。

4. 图表效果参考
*通过调整不同的参数组合,可绘制多种效果韦恩图,部分样式参考如下:
1)描边颜色白,描边粗细3,配色bold

2)描边粗细0,配色bold,不透明度约80%

Q1. 上传的数据需要保存成什么格式?文件名称和拓展名有没有要求?
OmicShare当前支持txt(制表符分隔)文本文件、csv(逗号分隔)文本文件、以及Excel专用的xlsx格式,同样支持旧版Excel的xls(Excel 97-2003 )格式。如果是核酸、蛋白序列文件,必须为FASTA格式(本质是文本文件)。
文件名可由英文和数字构成,文件拓展名没有限制,可以是“.txt”、“.xlsx”、“.xls”、“.csv”“.fasta”等,例如 mydata01.txt,gene02.xlsx 。
Q2. 提交时报错常见问题:
1.提交时显示X行X列空行/无数据,请先自查表格中是否存在空格或空行,需要删掉。
2.提交时显示列数只有1列,但表格数据不止1列:列间需要用分隔符隔开,先行检查文件是否用了分隔符。
其它提示报错,请先自行根据提示修改;如果仍然无法提交,可通过左侧导航栏的“联系客服”选项咨询OmicShare客服。
Q3. 提交的任务完成后却不出图该怎么办?
主要原因是上传的数据文件存在特殊符号所致。可参考以下建议逐一排查出错原因:
(1)数据中含中文字符,把中文改成英文;
(2) 数据中含特殊符号,例如 %、NA、+、-、()、空格、科学计数、罗马字母等,去掉特殊符号,将空值用数字“0”替换;
(3)检查数据中是否有空列、空行、重复的行、重复的列,特别是行名(一般为gene id)、列名(一般为样本名)出现重复值,如果有删掉。
排查完之后,重新上传数据、提交任务。如果仍然不出图,可通过左侧导航栏的“联系客服”选项咨询OmicShare客服。
Q4.下载的结果文件用什么软件打开?
OmicShare云平台的结果文件(例如,下图为KEGG富集分析的结果文件)包括两种类型:图片文件和文本文件。

图片文件:
为了便于用户对图片进行后期编辑,OmicShare同时提供位图(png)和矢量图(pdf、svg)两种类型的图片。对于矢量图,最常见的是pdf和svg格式,常用Ai(Adobe illustrator)等进行编辑。其中,svg格式的图片可用网页浏览器打开,也可直接在word、ppt中使用。
文本文件:
文本文件的拓展名主要有4种类型:“.os”、“.xls”、“.log”和“.txt”。这些文件本质上都是制表符分隔的文本文件,使用记事本、Notepad++、EditPlus、Excel等文本编辑器直接打开即可。结果文件中,拓展名为“.os”文件为上传的原始数据;“.xls”文件一般为分析生成的数据表格;“.log”文件为任务运行日志文件,便于检查任务出错原因。
Q5. 提交的任务一直在排队怎么办?
提交任务后都需要排队,1分钟后,点击“任务状态刷新”按钮即可。除了可能需运行数天的注释工具,一般工具数十秒即可出结果,如果超出30分钟仍无结果,请联系OS客服,发送任务编号给OmicShare客服,会有专人为你处理任务问题。
Q6. 结果页面窗口有问题,图表加载不出来怎么办?
尝试用谷歌浏览器登录OmicShare查看结果文件,部分浏览器可能不兼容。
引用OmicShare Tools的参考文献为:
Mu, Hongyan, Jianzhou Chen, Wenjie Huang, Gui Huang, Meiying Deng, Shimiao Hong, Peng Ai, Chuan Gao, and Huangkai Zhou. 2024. “OmicShare tools: a Zero‐Code Interactive Online Platform for Biological Data Analysis and Visualization.” iMeta e228. https://doi.org/10.1002/imt2.228案例1:
发表期刊:Environmental Science & Technology
影响因子:11.4
发表时间:2023
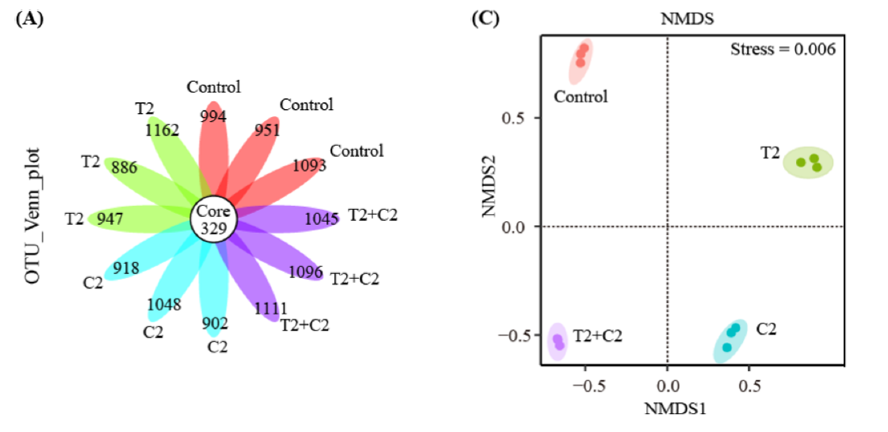
Figure 2. Microbial composition (A), and the intergroup difference (C) in seawater after 60 days of HTO, C-14 exposure.
引用方式:The OmicShare platform was used for clustering heatmaps, NMDS, and RDA analysis (https://www.omicshare.com/tools/).
参考文献:
Lai J, Li Z, Wang Y, et al. Tritium and Carbon-14 Contamination Reshaping the Microbial Community Structure, Metabolic Network, and Element Cycle in the Seawater Environment[J]. Environmental Science & Technology, 2023, 57(13): 5305-5316.
案例2:
发表期刊:Fishes
影响因子:2.3
发表时间:2023
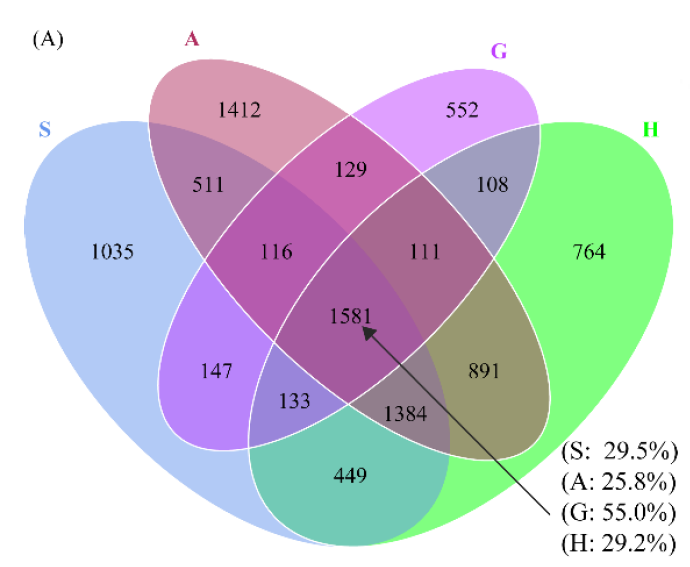
Figure 6. (A) Venn diagram of OTU composition in the worm intestine and different sediments. The percentages in brackets of the Venn diagram indicate the ratios of the number of shared OTUs to the total number of OTUs in each group.
引用方式:In addition, the microbial community structure, including the heatmap analysis of the relative abundances of the dominant genera, the Venn diagram of OUT composition, and the Circos diagram of the dominant genera from the shared OTUs, was visualized using the free online platform OmicShare (http://www.omicshare.com/tools, accessed on 20 March 2022).
参考文献:
Li J, Chen S, Wu P, et al. Insights into the relationship between intestinal microbiota of the aquaculture worm Sipunculus nudus and surrounding sediments[J]. Fishes, 2023, 8(1): 32.
案例3:
发表期刊:Pharmaceutical Biology
影响因子:3.8
发表时间:2022
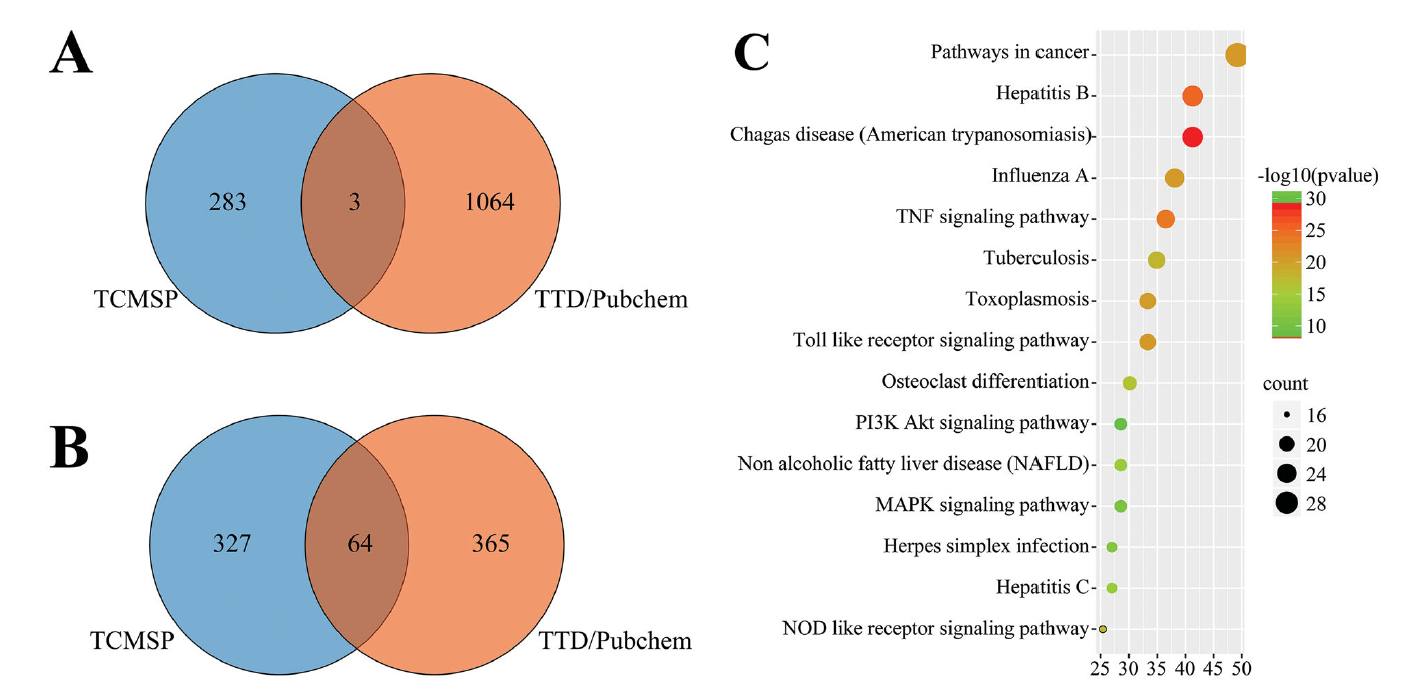
Figure 2. Integrated analysis of COVID-19 clinical TCM and CWM. (A) Venn analysis of effective compounds based on TCMSP, TTD, and PubChem databases. (B) Venn analysis of drug target genes based on TCMSP, TTD, and PubChem. (C) KEGG pathways of target genes.
引用方式:Venn diagrams and bubble graphs of the top fifteen items were generated using the free online analysis tool OmicShare (https://www.omicshare.com/tools).
参考文献:
Chen Y M, Wei J L, Qin R S, et al. Folic acid: A potential inhibitor against SARS-CoV-2 nucleocapsid protein[J]. Pharmaceutical Biology, 2022, 60(1): 862-878.
案例4:
发表期刊:Fish & Shellfish Immunology
影响因子:4.7
发表时间:2022
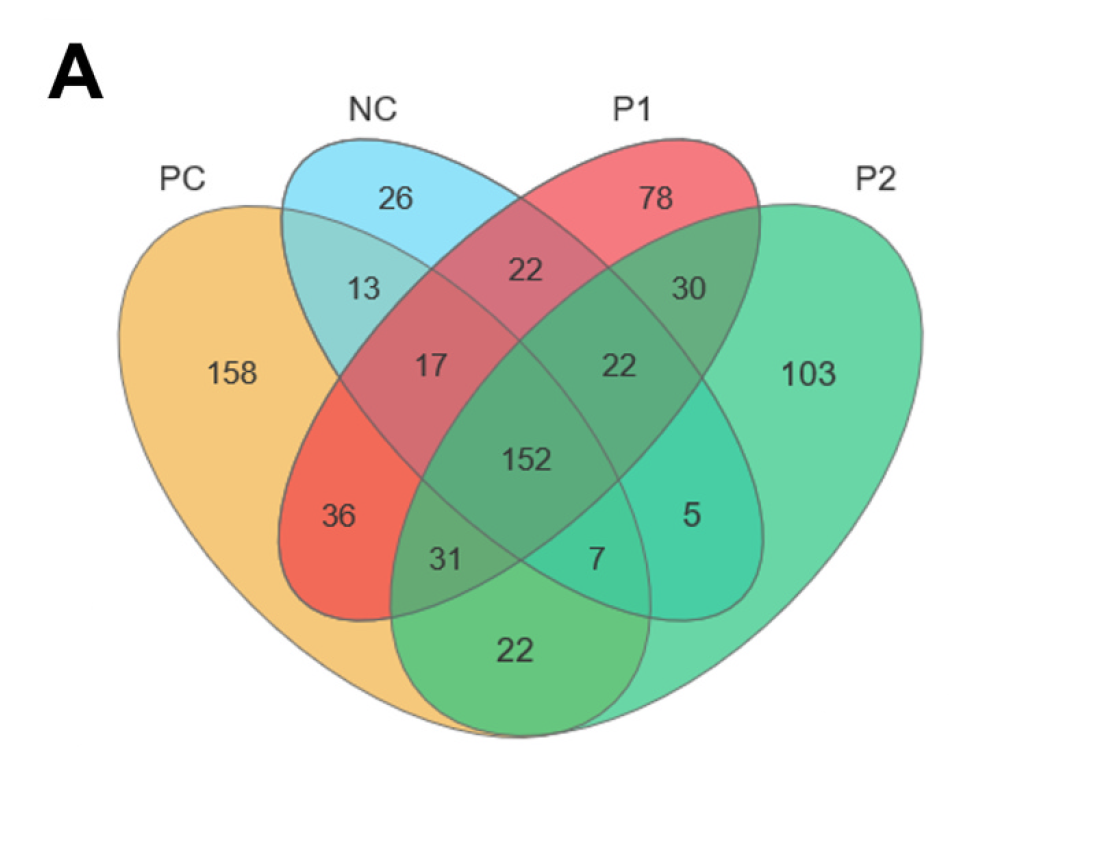
Fig 5. Gut microbiota responses (A) Venn diagram of shared and unique OTUs; (B) Principal coordinates analysis (PCoA) based on bray analysis Anosim test.
引用方式:Intergroup Venn analysis was conducted to identify endemic and shared OTUs using the microbial indicative analysis function of the Omicshare platform (https://www.omicshare.com/).
引用方式:
Moreover, the overall microbial composition was conducted with beta analysis through partial least squares discriminant analysis in the Omicshare platform.
参考文献:
Zheng C, Cao J, Chi S, et al. Dietary phosphorus supplementation in the diet of Pacific white shrimp (Litopenaeus vannamei) alleviated the adverse impacts caused by high Clostridium autoethanogenum protein[J]. Fish & Shellfish Immunology, 2022, 131: 137-149.
案例5:
发表期刊:Applied Biochemistry and Biotechnology
影响因子:3.0
发表时间:2022
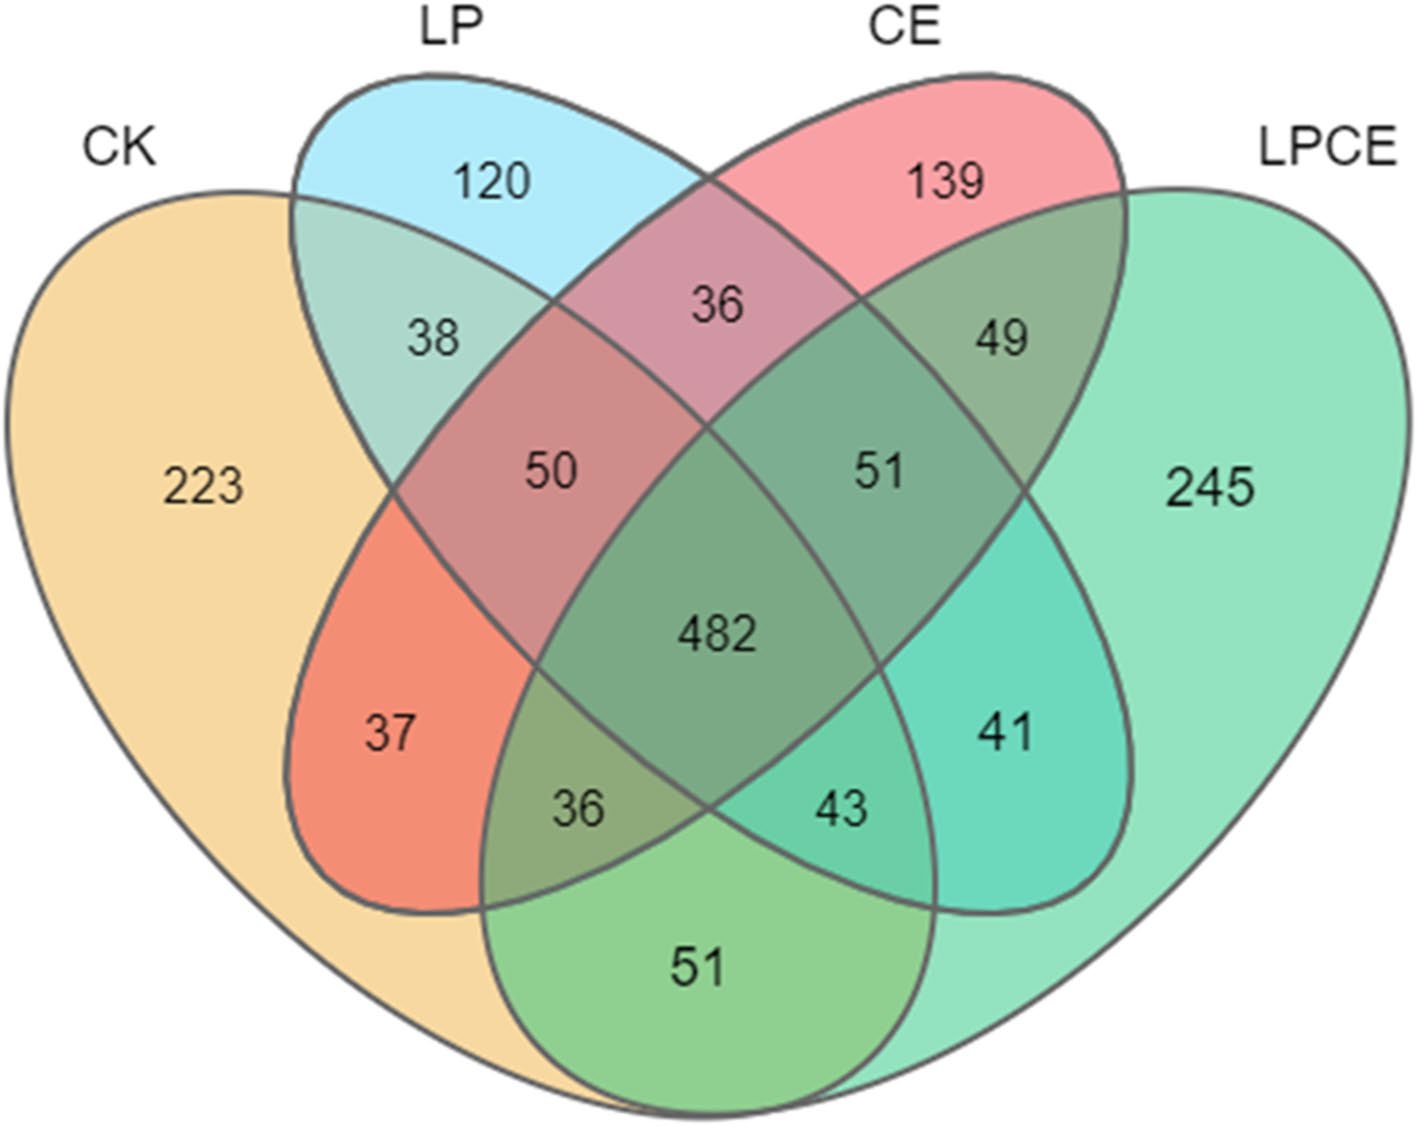
Fig 3. Venn diagram of different treatment groups based on the number of OTUs
引用方式:High-throughput sequencing data were analyzed using the OmicShare tools (https:// www. omics hare. com/ tools).
参考文献:
Wang Q, Wang R, Wang C, et al. Effects of cellulase and Lactobacillus plantarum on fermentation quality, chemical composition, and microbial community of mixed silage of whole-plant corn and peanut vines[J]. Applied Biochemistry and Biotechnology, 2022, 194(6): 2465-2480.
案例6:
发表期刊:Journal of Ethnopharmacology
影响因子:5.4
发表时间:2023
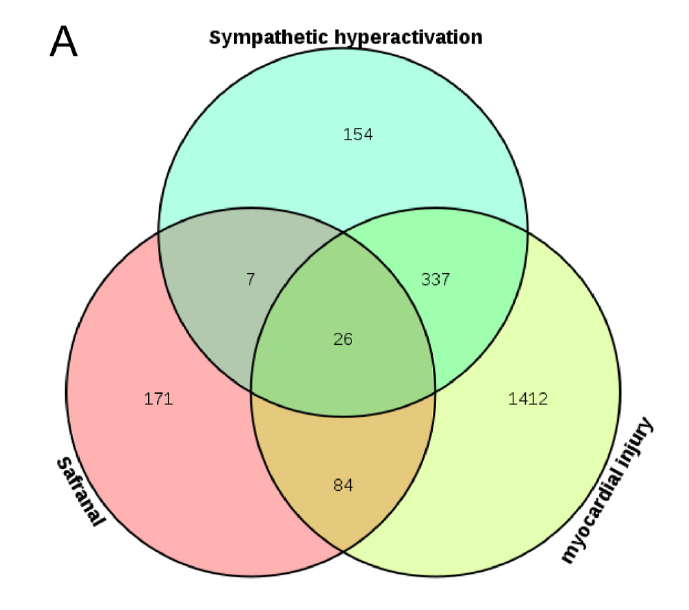
Fig. 6. Common targets of safranal-sympathetic hyperactivation-myocardial injury A Venn diagram of the common target of safranal-sympathetic hyperactivationmyocardial injury.
引用方式:The OmicShare website (https://www.omicshare.com/) was used to draw the dynamic enrichment bubble plot of GO analysis and signaling pathways.
参考文献:
Yan M, Zhao J, Kang Y, et al. Effect and mechanism of safranal on ISO-induced myocardial injury based on network pharmacology[J]. Journal of Ethnopharmacology, 2023, 305: 116103.
案例7:
发表期刊:Scientia Horticulturae
影响因子:4.3
发表时间:2023
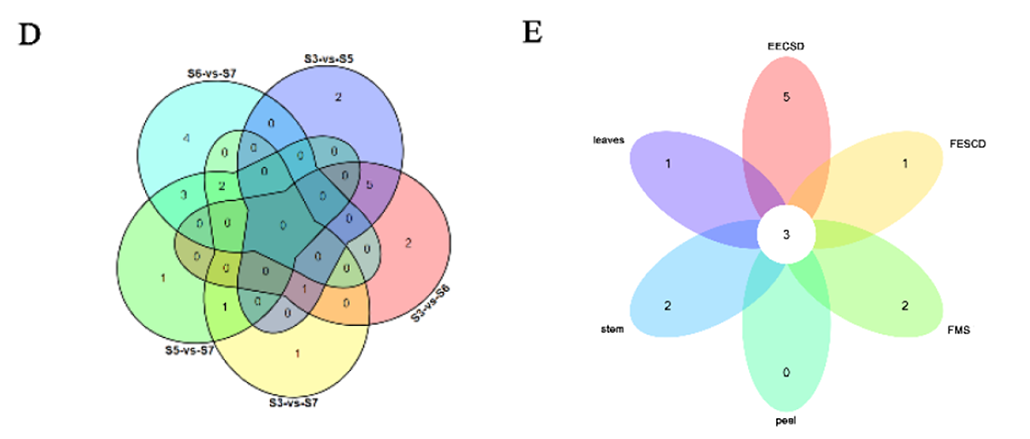
Fig. 5. Expression patterns analysis of CiB3 genes in different tissues and developmental stages. D Venn diagram of the results of differential analysis of different developmental stages of CiB3s kernels. E Venn diagram of the results of differential analysis of different tissues of CiB3s.
引用方式:The count values of CiB3s expression at four different pecan developmental stages were analyzed differentially using the OmicShare Tools online website (https://www.omicshare.com/tools/Home/Soft/getsoft). Furthermore, Venn diagrams were drawn for genes with TPM values above 10 in the B3 superfamily of different tissues.
参考文献:
Wang L, Chen F, Lan Y, et al. Genome-wide identification of B3 superfamily in pecan (Carya illinoensis): In silico and experimental analyses[J]. Scientia Horticulturae, 2023, 307: 111533.
案例8:
发表期刊:Journal of gastrointestinal oncology
影响因子:2.1
发表时间:2021
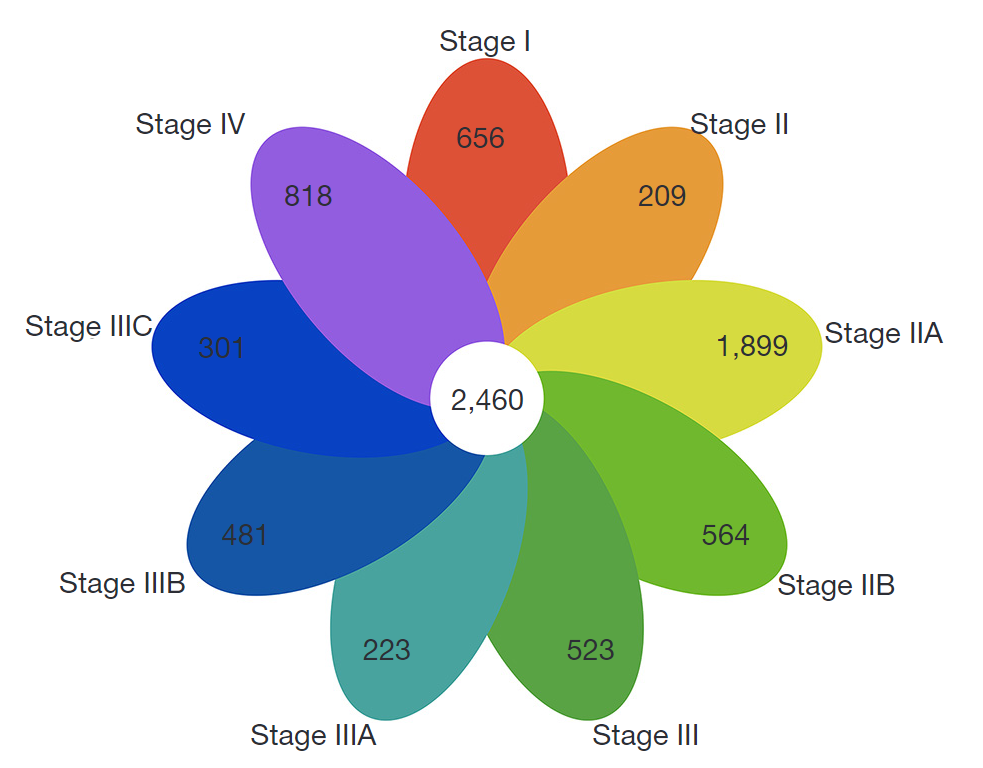
Figure 1 Venn diagram of differentially expressed protein-coding transcripts. The numbers in the different colored petals represent differentially expressed protein-coding transcripts obtained after the comparison of COAD tissues with normal tissues at each stage. The 9 petals show an overlap of 2,460 protein-coding transcripts in the Venn diagram. COAD, colon adenocarcinoma.
引用方式:A Venn diagram was plotted using OmicShare tools, a free online platform for data analysis (http://www.omicshare.com/tools).
参考文献:
Zhang Z, Luo A, Zeng Z, et al. Identification of hub genes and functional modules in colon adenocarcinoma based on public databases by bioinformatics analysis[J]. Journal of gastrointestinal oncology, 2021, 12(4): 1613-1624.