


 扫码支付更轻松

1. 切换任务
下拉框内选择相应任务编号,可以切换任务查看。由于火山图基因数目较多,切换时需稍作等待;

2. 基本设置更改
在基本设置中,可对文本样式、坐标轴系、图例相关参数进行修改;
3. 图形设置更改
在图形设置中,可对图形相关参数进行修改;
或直接选择美化模板:
4. 自定义标签添加
使用套索模式,或在下方表格中勾选想要展示的id标签,即可在火山图中显示;
在图形设置——已选中散点模块中,可对选中的散点、文本标签、标签线的颜色、大小等进行修改。
1. 功能
以组间差异倍数取以2为底的对数(log2(FC))为横坐标,以差异显著性检验P值或FDR值取10为底的对数的负值-log10(p)/-log10(FDR)为纵坐标,给差异显著(一般为差异倍数为2倍以上,且P/FDR值小于0.05)的点赋不同的颜色,来显示两组样品间的差异显著性,支持在图内单独标注关注的基因id。
2. 应用范围
适用于可视化转录组、蛋白组、代谢组、微生物、单细胞等组学中差异数据可视化。
3. 输入
文件格式:支持txt(制表符分隔)文本文件、csv(逗号分隔)文本文件、以及Excel专用的xlsx格式,同样支持旧版Excel的xls(Excel 97-2003 )格式。
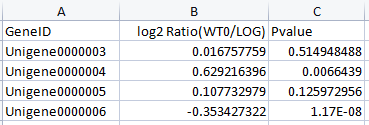
数据格式:差异分析结果表格,需包含绘图所需列(ID列、FC/Log2FC、Pvalue/FDR等),参考数据如下:
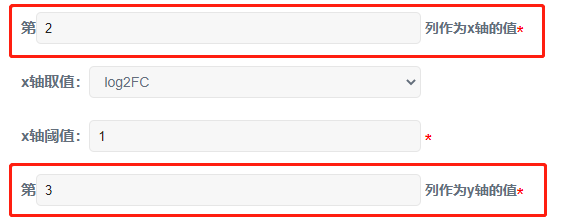
前端参数选择:
1)第___列作为x轴的值:差异倍数(FC/Log2FC)所在的列;
2)x轴取值:
a. 如果输入文件中的原始值是差异倍数(FC),那么下拉菜单应该选择 FC,软件会自动对FC值取log2,然后绘制火山图;
b.如果输入文件中的原始值是差异倍数的log2值(log2FC),那么下拉菜单应该选择log2FC,软件将不对输入值进行处理,直接绘制火山图;
3)x轴阈值:即差异倍数的阈值,上下调差异倍数一致。若X轴取值选择FC,一般输入值为2或1.5;若X轴取值选择log2FC,一般输入值为1,即FC取log2后的值;
4)第___列作为y轴的值:P值所在列或FDR值所在的列;
5)y轴阈值:P值或FDR值的阈值一般设定0.01或0.05,可自定义输入。
注:若文件超过5Mb大小则需要在“我的数据”版块中上传本地数据,之后在工具页面选择云端文件进行分析。
4. 结果输出
程序根据输入的文件进行计算、绘图,过程中等待时间与输入文件大小有关。可以在结果展示中切换任务进行查看。
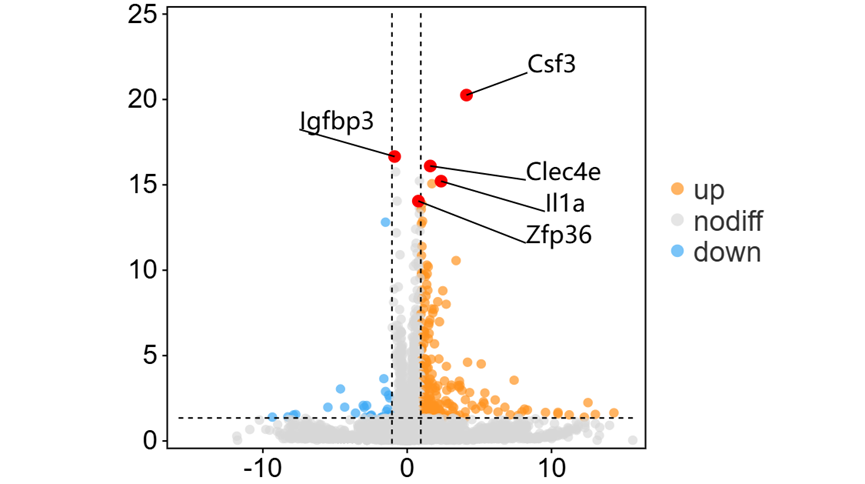
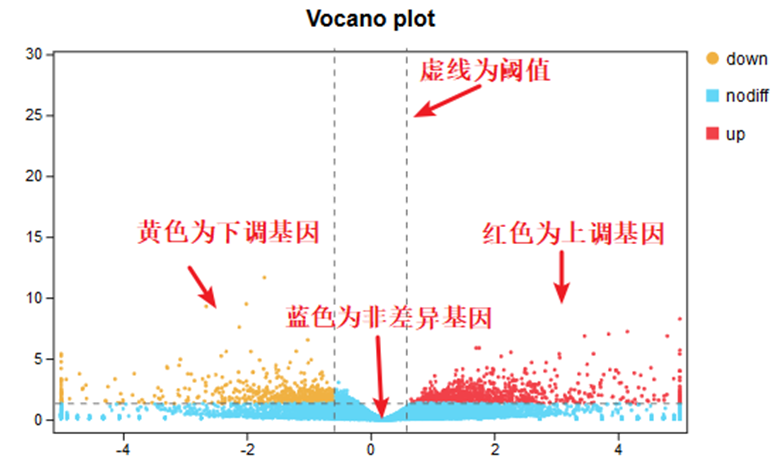
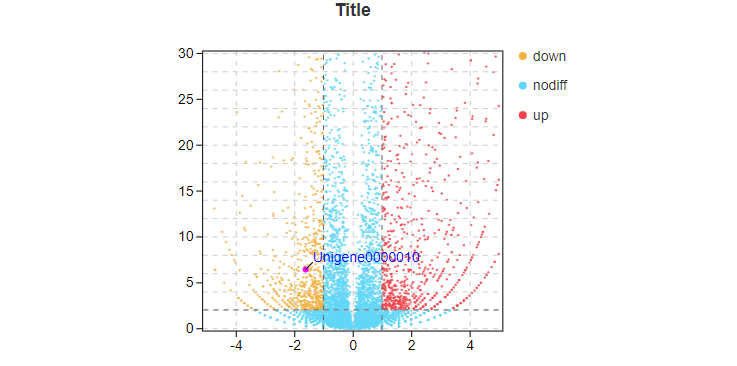
5. 图表解读
根据设定的参数,筛选出差异基因。默认图形中横坐标为log2(FC)值,纵坐标为P值或FDR值取-log10后的值。虚线代表设定分别设定的阈值,垂直y轴的虚线,为P/FDR阈值,虚线上为符合阈值的基因;垂直X轴的虚线,代表差异倍数阈值,虚线范围之外为符合阈值的基因。
同时满足以上两个条件的基因为差异基因,如下图中,红色代表上调差异基因(up),黄色代表下调差异基因(down),蓝色代表不符合阈值筛选的基因(nodiff)。
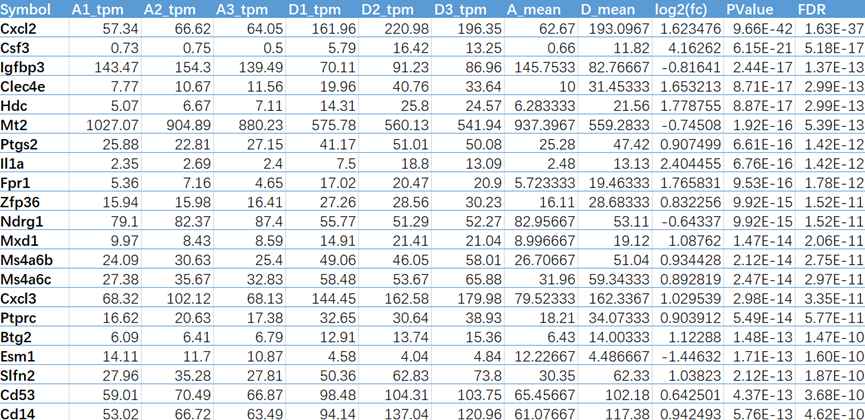
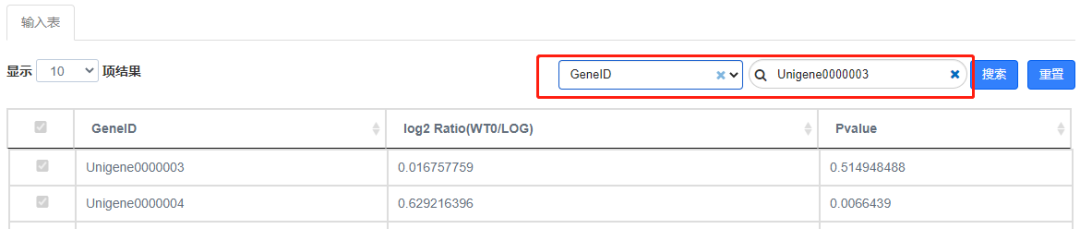
6. 表格说明
1)表格各列为上传的数据信息;
2)选择相应列,在搜索框内键入相应信息,可搜索到对应基因并激活。激活后可以在图形参数对目标基因样式单独做修改。
7. 重点图形参数说明
X/Y轴刻度:默认情况下,X/Y轴刻度根据数据自适应,也可按照个人所需自行修改显示范围;
未选中散点——
散点大小:全部散点大小的批量调整,可选择渐变模式或单一模式,渐变模式下散点大小根据上传数据的-log10Pvalue(-log10Qvalue)值变化;
散点颜色:可选单一模式或渐变模式,单一模式下为传统三色上下调变化,渐变模式下,散点颜色根据上传数据的log2fc数据变化;
已选中散点——
在图表下方的表格中勾选想要在火山图中显示标签的id,或使用套索模式在图中圈选目标散点后,可对选中的散点及标签进行修改:
散点大小:选中散点的大小调整;
散点名称:是否在火山图中显示选中散点的id标签;
字号选择:选中散点的标签字号选择;
散点颜色:选中散点的颜色修改;
标签线的颜色:选中散点对应标签线颜色修改
Q1. 数据文件名称有没有要求?
OmicShare当前支持文件命名为中文、英文、符号仅支持英文点号“.”及下划线"_"。
不支持空格及其他特殊符号。
Q2. 提交时报错常见问题:
1.提交时显示X行X列空行/无数据,请先自查表格中是否存在空格或空行,需要删掉。
2.提交时显示列数只有1列,但表格数据不止1列:列间需要用分隔符隔开,先行检查文件是否用了分隔符。
Q3. 为什么提示x轴y轴数据不能来自同一列?

在提交分析前,需要选择log2(FC)、P值或FDR值所在列。没有填写所在列则会如上提示。
Q4.为什么任务出错?
如果数据文件没有问题,可以检查是否log2(FC)、P值或FDR值所在列选错。
注意:“第_列作为x/y轴的值”这里需要填写阿拉伯数字!
例:
比如在我的数据中,log2(FC)在2列,P value在3列,这里相应填上2、3就可以了,而切勿输入B列、C列!
Q5. 如何对火山图进行调整(文字/图形样式调整)?
使用动态火山图工具,在任务完成后,点击“跳转查看”小图标即可跳转界面修改。

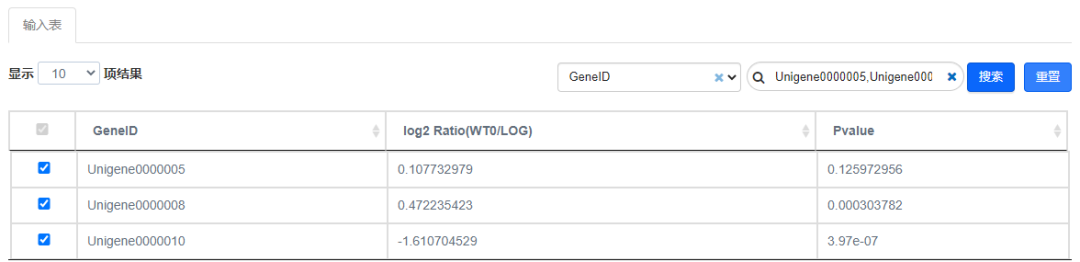
Q6. 如何在火山图中标注基因?
图中标注基因的功能需要使用动态火山图工具。
在动态调整窗口下拉,可以看到结果输入表,①选择需要搜索的列;②在筛选框中输入需要标注的基因名,即可将基因在火山图中标注显示。
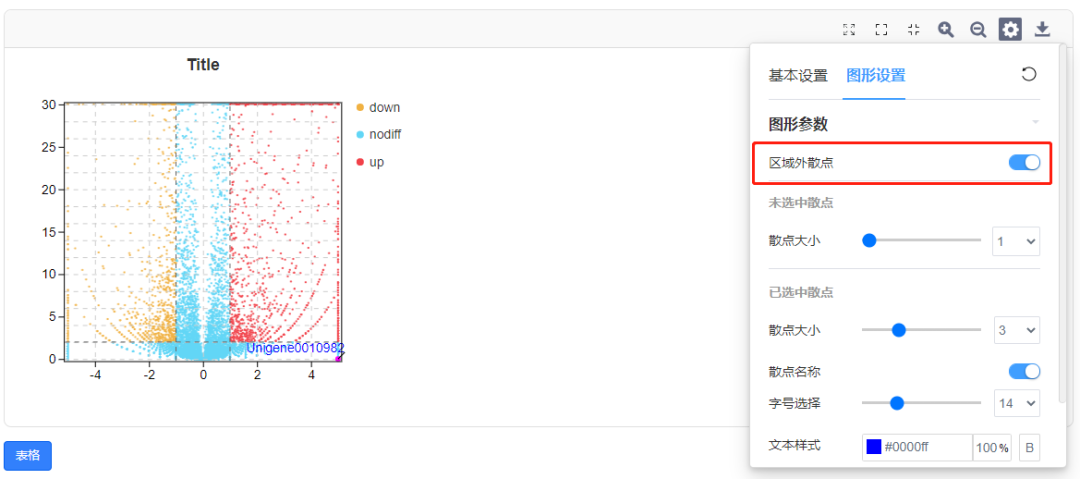
如果筛选的数据不在区域内,则需要把“区域外散点”按钮打开,才能在图上显示。
具体操作:动态调整窗口——图形设置——图形参数——区域外散点
Q9. 为什么表格无法勾选?
在筛选栏中有多个数据,勾选栏才会变成蓝色可选状态。此时,可以通过勾选或取消勾选,选择图中是否显示该基因。
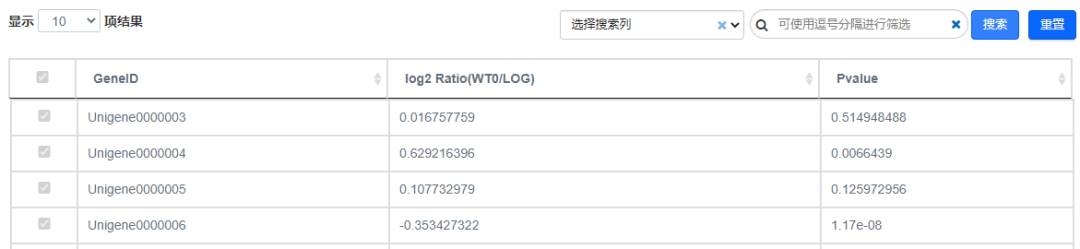
不可勾选状态
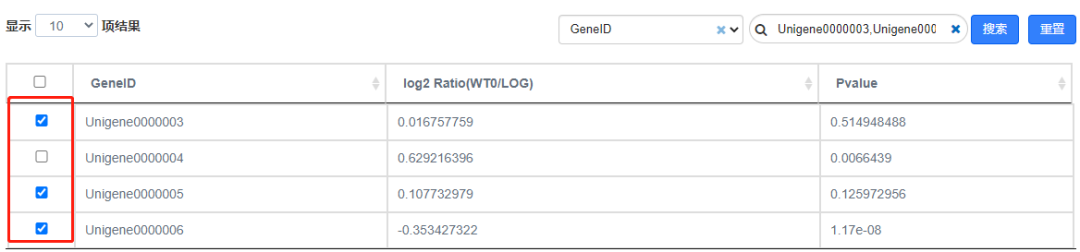
筛选多个基因后 可勾选状态
引用OmicShare Tools的参考文献为:
Mu, Hongyan, Jianzhou Chen, Wenjie Huang, Gui Huang, Meiying Deng, Shimiao Hong, Peng Ai, Chuan Gao, and Huangkai Zhou. 2024. “OmicShare tools: a Zero‐Code Interactive Online Platform for Biological Data Analysis and Visualization.” iMeta e228. https://doi.org/10.1002/imt2.228案例1
发表期刊:Ecotoxicology and Environmental Safety
影响因子:6.8
发表时间:2022
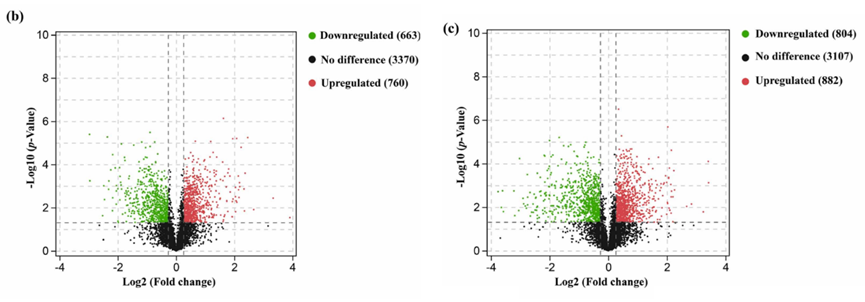
Fig. 4. b&c, Volcano plots of protein quantifications in CK group (b) and AZA exposure group (c), respectively, and the logarithmic fold changes of iTRAQ quantification intensities were plotted by the negative decadic logarithm of the p value. The number of up-/down-regulated DAPs was obtained by comparing the protein abundance in adult ovary with that in pupal ovary in S. litura under normal and AZA exposure condition, respectively.
引用方式:
Volcano plots were performed using the OmicShare tools (https://www.omicshare.com/tools) with default settings.
参考文献:
Sun R, Xu Y, Liu J, et al. Proteomic profiling for ovarian development and azadirachtin exposure in Spodoptera litura during metamorphosis from pupae to adults[J]. Ecotoxicology and Environmental Safety, 2022, 237: 113548.
案例2
发表期刊:Frontiers in Molecular Neuroscience
影响因子:4.8
发表时间:2022
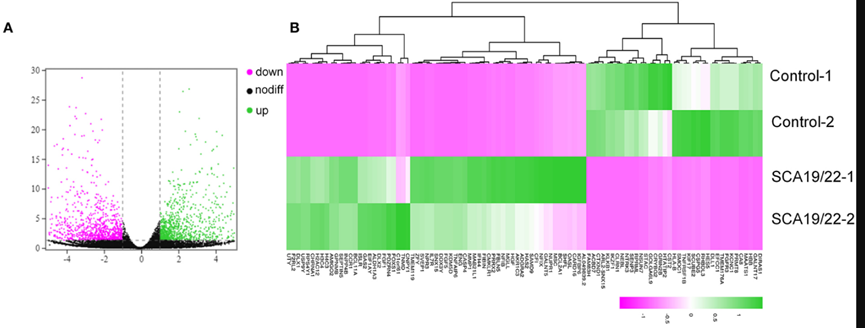
FIGURE 5. A visualization of the transcriptome data analysis. The volcano map (A) and heatmap (B) of the gene expression. The red gene is upregulated and the green gene is downregulated. |log2 (FC)| >1 is considered to be significant.
引用方式:
We drew the volcano map and the heatmap of the DEGs using the OmicShare tools(www.omicshare.com/tools).
参考文献:
Li M, Liu F, Hao X, et al. Rare KCND3 Loss-of-Function mutation associated with the SCA19/22[J]. Frontiers in Molecular Neuroscience, 2022, 15: 919199.
案例3:
发表期刊:Journal of agricultural and food chemistry
影响因子:6.1
发表时间:2020
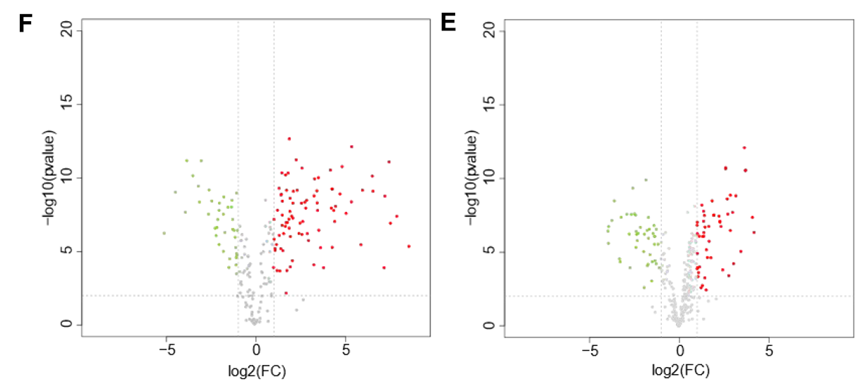
Figure 5. Characterization of PCH, FCH, and P-FCH in terms of amino acid and peptide profiles. (E) Volcano plot of peptides in PFCH vs PCH (red dots denote upregulation, and green dots denote downregulation). (F) Volcano plot of peptides in P-FCH vs FCH (red dots denote upregulation, and green dots denote downregulation).
引用方式:
The distribution of peptides in each hydrolysate was analyzed by an UpSet Venn diagram (http://www.omicshare.com/ tools). Variation analysis of the peak areas in common peptides was shown by the volcano plot (http://www.omicshare.com/tools).
参考文献:
Wang C, Zheng L, Su G, et al. Evaluation and exploration of potentially bioactive peptides in casein hydrolysates against liver oxidative damage in STZ/HFD-induced diabetic rats[J]. Journal of agricultural and food chemistry, 2020, 68(8): 2393-2405.
案例4:
发表期刊:Infection and Drug Resistance
影响因子:3.9
发表时间:2022
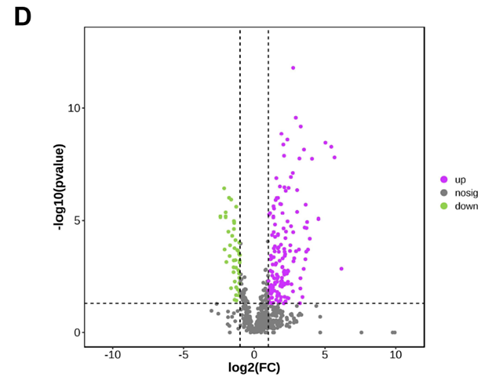
Figure 2 Data quality control and differential screening. (D) volcano plot showing up-regulated (purple) and down-regulated (green) proteins screened by differential analysis, with the logarithm of the difference multiplicity (log2) as the horizontal coordinate and the negative logarithm of the p-value (log10) as the vertical coordinate.
引用方式:
Differentially expressed proteins were screened using the OmicShare online platform (https://www.omicshare.com/) with the screening criteria: p<0.05 and |FC|≥2.0. Transcriptomic and proteomic data are submitted to OmicShare platform to construct a nine-quadrant map.
参考文献:
Wang C, Li Y, Li S, et al. Proteomics combined with RNA sequencing to screen biomarkers of sepsis[J]. Infection and Drug Resistance, 2022: 5575-5587.