


 扫码支付更轻松

1. 行数变化和图形修改
2.图形大小调整和下载
1.功能
以Circos图的环形布局直观展示任意二维矩阵(即行名、列名、数值)的数据分布特征。推荐行数、列数小于10。
2.应用范围
转录组、微生物、代谢组等各组学的数据分布展示,如分组+基因/功能+表达量;分组+物种/功能/代谢物+丰度;功能+物种注释+丰度;Go term+上下调+基因数量;分组+富集的代谢通路+通路的基因数量等。
3.输入
输入文件:支持txt(制表符分隔)文本文件、csv(逗号分隔)文本文件、以及Excel专用的xlsx格式,同样支持旧版Excel的xls(Excel 97-2003 )格式。文件名可由英文和数字构成,文件拓展名没有限制,可以是“.txt”、“.xlsx”、“.xls”、“.csv”等,例如 mydata01.txt,gene02.xlsx 。
4.参数
展示top____行的数据:即按输入文件表格的行顺序,自定义展示前几行的数据,便于根据丰度分布效果增减展示目标。
5.分析操作
1)修改弦(即圆环中的连线)透明度
2)修改旋转角度,如上下布局或左右布局等
3)选择图形刻度显示原始输入数值或转化为百分比
4)是否显示弦边框
5)切换行名、列名的配色方案,修改颜色
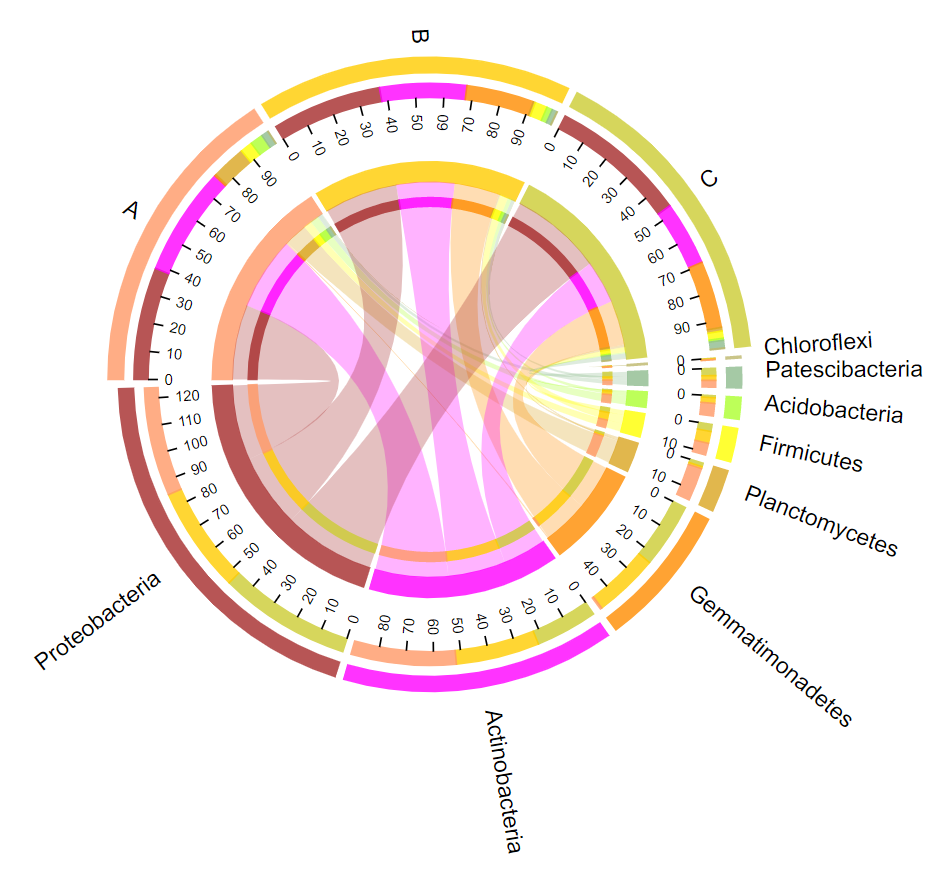
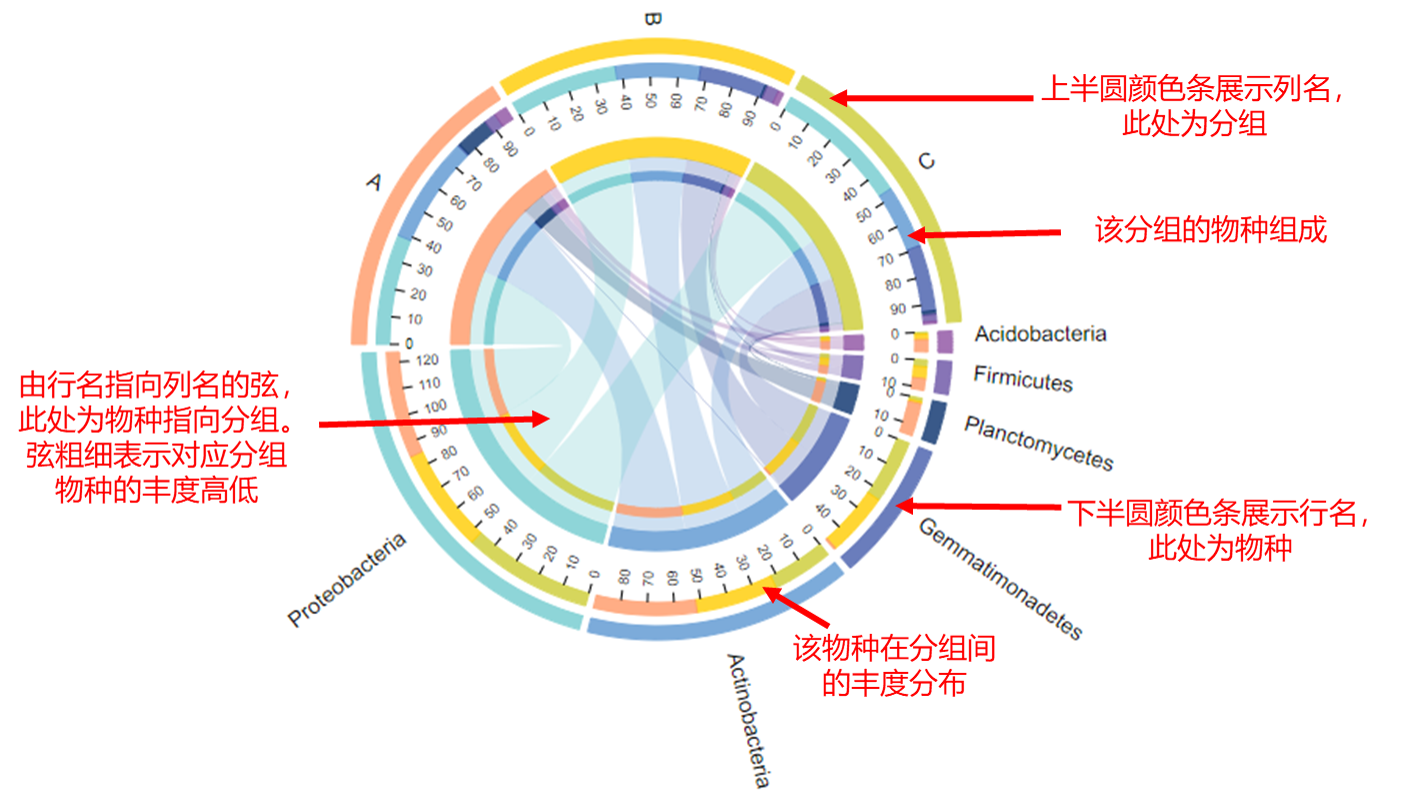
6.图形解读
如下图,图形最外环的颜色对应行名和列名,如物种和分组;刻度数值表示对应颜色标签的丰度数值或占比;内环的弦由行名发出,指向列名;弦粗细表示数值高低。
Q1. 上传的数据需要保存成什么格式?文件名称和拓展名有没有要求?
OmicShare当前支持txt(制表符分隔)文本文件、csv(逗号分隔)文本文件、以及Excel专用的xlsx格式,同样支持旧版Excel的xls(Excel 97-2003 )格式。如果是核酸、蛋白序列文件,必须为FASTA格式(本质是文本文件)。
文件名可由英文和数字构成,文件拓展名没有限制,可以是“.txt”、“.xlsx”、“.xls”、“.csv”“.fasta”等,例如 mydata01.txt,gene02.xlsx 。
Q2. 提交时报错常见问题:
1.提交时显示X行X列空行/无数据,请先自查表格中是否存在空格或空行,需要删掉。
2.提交时显示列数只有1列,但表格数据不止1列:列间需要用分隔符隔开,先行检查文件是否用了分隔符。
其它提示报错,请先自行根据提示修改;如果仍然无法提交,可通过左侧导航栏的“联系客服”选项咨询OmicShare客服。
Q3. 提交的任务完成后却不出图该怎么办?
主要原因是上传的数据文件存在特殊符号所致。可参考以下建议逐一排查出错原因:
(1)数据中含中文字符,把中文改成英文;
(2) 数据中含特殊符号,例如 %、NA、+、-、()、空格、科学计数、罗马字母等,去掉特殊符号,将空值用数字“0”替换;
(3)检查数据中是否有空列、空行、重复的行、重复的列,特别是行名(一般为gene id)、列名(一般为样本名)出现重复值,如果有删掉。
排查完之后,重新上传数据、提交任务。如果仍然不出图,可通过左侧导航栏的“联系客服”选项咨询OmicShare客服。
Q4.下载的结果文件用什么软件打开?
OmicShare云平台的结果文件(例如,下图为KEGG富集分析的结果文件)包括两种类型:图片文件和文本文件。

图片文件:
为了便于用户对图片进行后期编辑,OmicShare同时提供位图(png)和矢量图(pdf、svg)两种类型的图片。对于矢量图,最常见的是pdf和svg格式,常用Ai(Adobe illustrator)等进行编辑。其中,svg格式的图片可用网页浏览器打开,也可直接在word、ppt中使用。
文本文件:
文本文件的拓展名主要有4种类型:“.os”、“.xls”、“.log”和“.txt”。这些文件本质上都是制表符分隔的文本文件,使用记事本、Notepad++、EditPlus、Excel等文本编辑器直接打开即可。结果文件中,拓展名为“.os”文件为上传的原始数据;“.xls”文件一般为分析生成的数据表格;“.log”文件为任务运行日志文件,便于检查任务出错原因。
Q5. 提交的任务一直在排队怎么办?
提交任务后都需要排队,1分钟后,点击“任务状态刷新”按钮即可。除了可能需运行数天的注释工具,一般工具数十秒即可出结果,如果超出30分钟仍无结果,请联系OS客服,发送任务编号给OmicShare客服,会有专人为你处理任务问题。
Q6. 结果页面窗口有问题,图表加载不出来怎么办?
尝试用谷歌浏览器登录OmicShare查看结果文件,部分浏览器可能不兼容。
引用OmicShare Tools的参考文献为:
Mu, Hongyan, Jianzhou Chen, Wenjie Huang, Gui Huang, Meiying Deng, Shimiao Hong, Peng Ai, Chuan Gao, and Huangkai Zhou. 2024. “OmicShare tools: a Zero‐Code Interactive Online Platform for Biological Data Analysis and Visualization.” iMeta e228. https://doi.org/10.1002/imt2.228案例1:
发表期刊:Ecotoxicology and Environmental Safety
影响因子:6.8
发表时间:2023
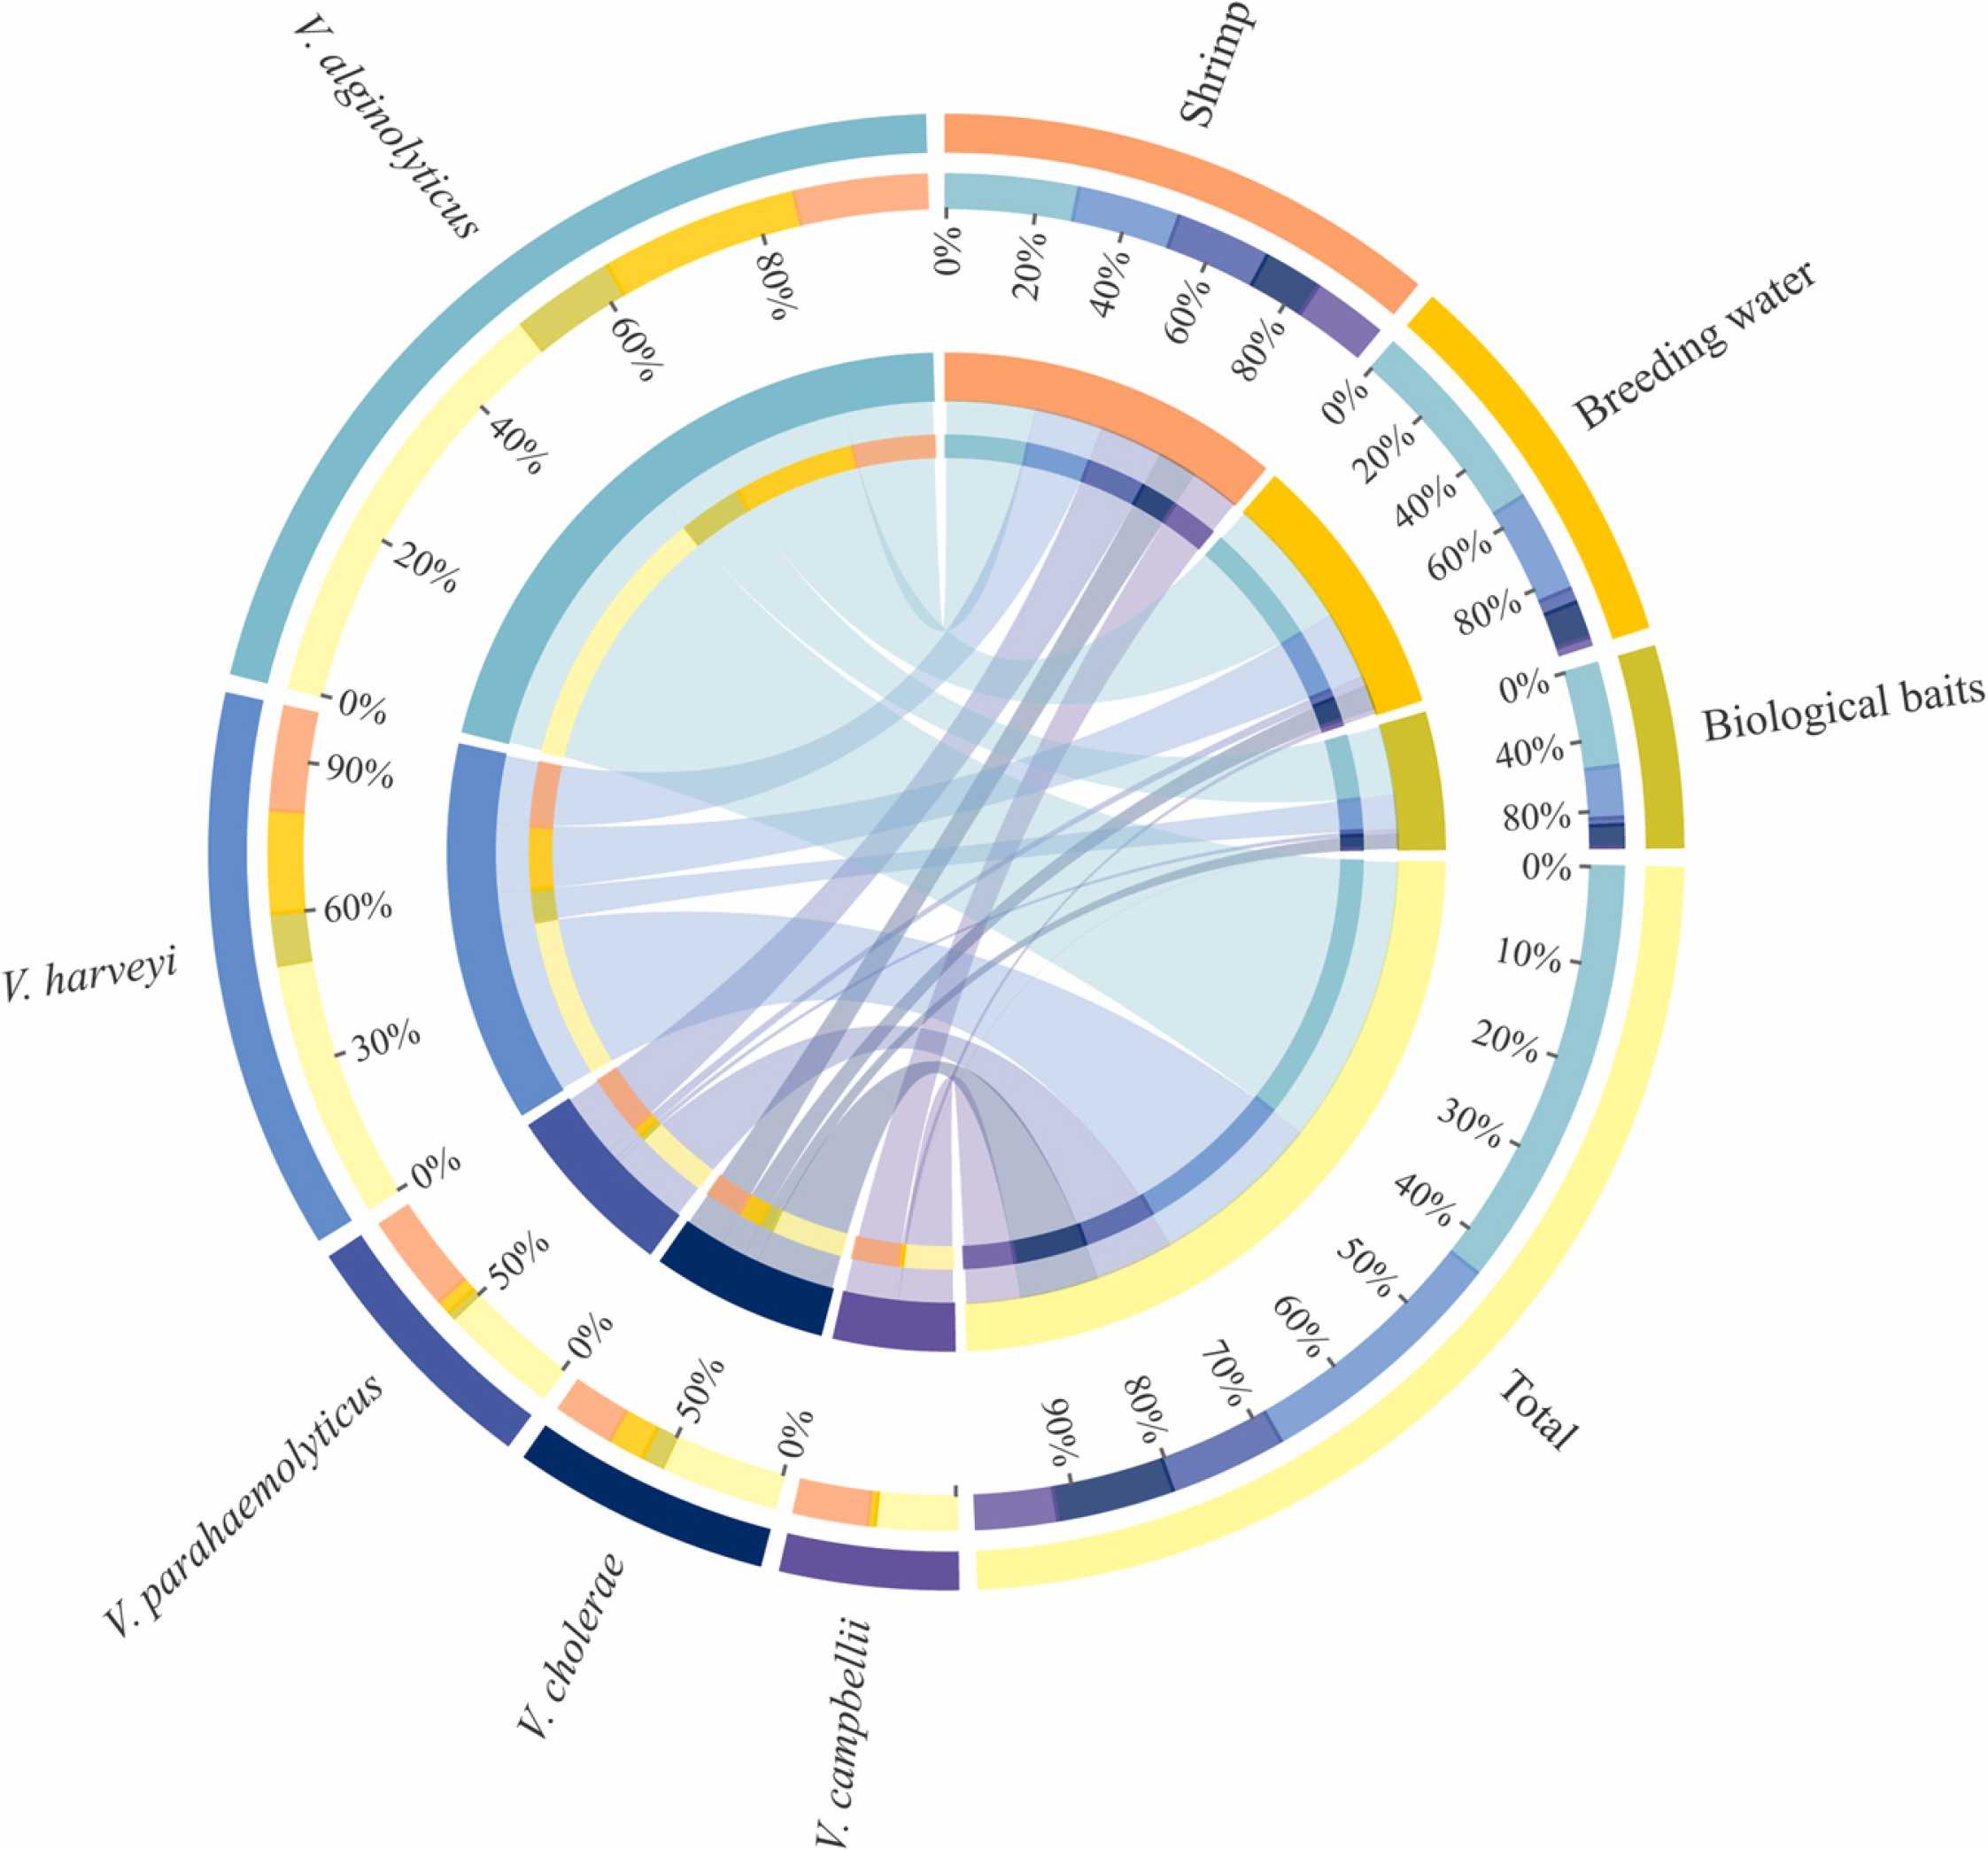
Fig. 1. Prevalence of Vibrio species across the shrimp breeding programs. The left half circle represents the proportion of Vibrio species in the sample, the outer circle represents the sample; the color of the inner circle represents different Vibrio species, and the length represents the distribution proportion of Vibrio species in the corresponding sample. The right half circle represents the distribution ratio of samples in different Vibrio species, the outer circle represents the Vibrio species, the color of the inner circle represents different samples, and the length represents the distribution ratio of the sample in a certain Vibrio species. The scale value represents the proportion of the corresponding color label. And the line in the middle indicates the presence of a Vibrio species in a sample, and the thicker the line segment, the richer the content of the Vibrio species.
引用方式:Using the relevant tools in the omicshare cloud platform (https://www.omicshare.com/) to create circos and heat maps.
参考文献:
Yu Y, Tang M, Wang Y, et al. Virulence and antimicrobial resistance characteristics assessment of Vibrio isolated from shrimp (Penaeus vannamei) breeding system in south China[J]. Ecotoxicology and Environmental Safety, 2023, 252: 114615.
案例2:
发表期刊:Fishes
影响因子:2.3
发表时间:2023
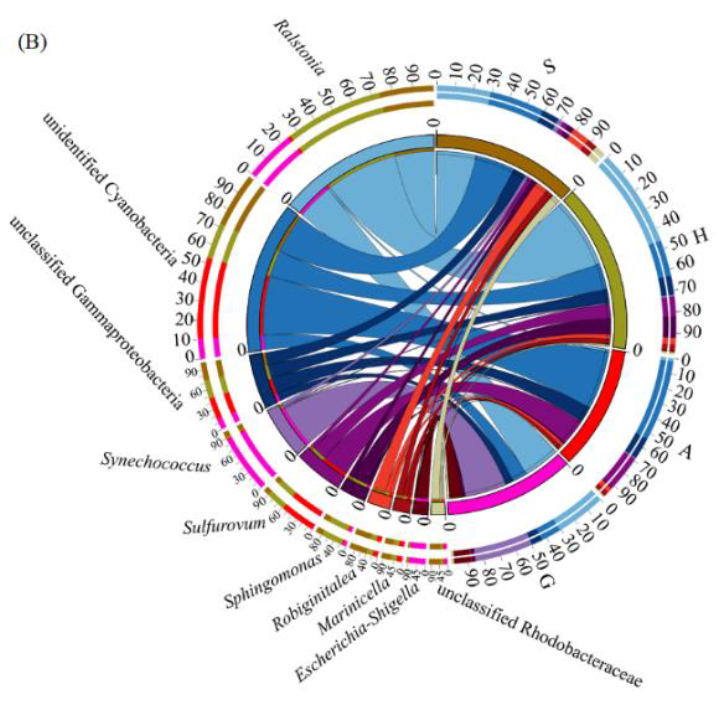
Figure 6. (A) Venn diagram of OTU composition in the worm intestine and different sediments. The percentages in brackets of the Venn diagram indicate the ratios of the number of shared OTUs to the total number of OTUs in each group.
引用方式:In addition, the microbial community structure, including the heatmap analysis of the relative abundances of the dominant genera, the Venn diagram of OUT composition, and the Circos diagram of the dominant genera from the shared OTUs, was visualized using the free online platform OmicShare (http://www.omicshare.com/tools, accessed on 20 March 2022).
参考文献:
Li J, Chen S, Wu P, et al. Insights into the relationship between intestinal microbiota of the aquaculture worm Sipunculus nudus and surrounding sediments[J]. Fishes, 2023, 8(1): 32.
案例3:
发表期刊:Journal of applied microbiology
影响因子:4.0
发表时间:2020
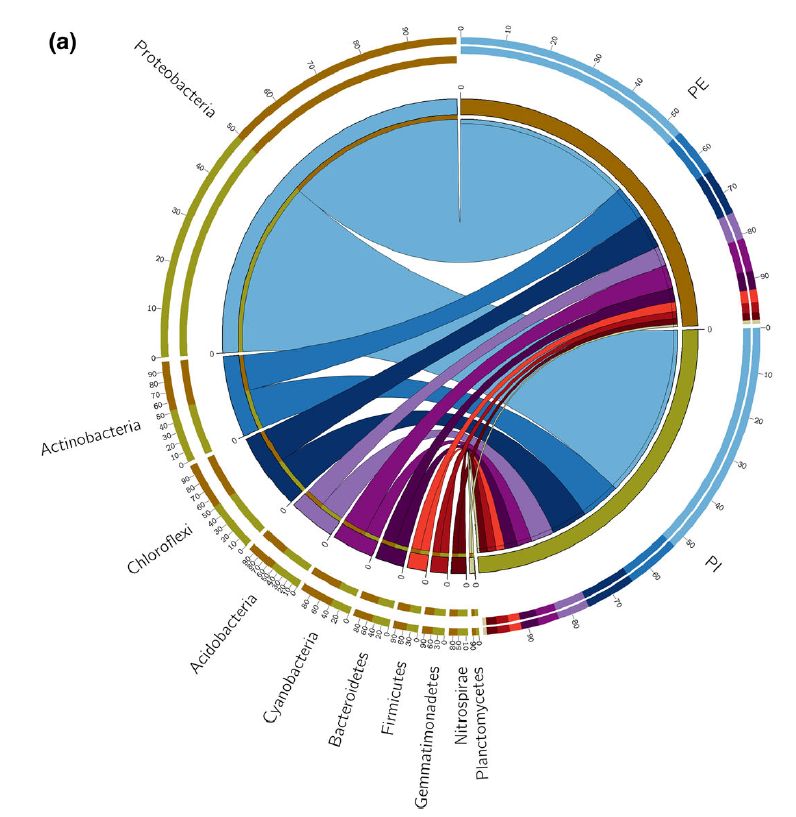
Fig 6. Relative abundance of the rhizosphere bacterial community. (a) Circos represent the bacterial phyla and apple rootstocks. The right side shows apple rootstocks, and the left side shows bacterial phyla. The innermost lines indicate the connections between the bacteria and rootstock. The thickness of the lines indicates the abundance of the bacteria.
引用方式:Circos were analysed using OmicShare tools (http://www.omicshare.com/tools).
参考文献:
Chai X, Xie L, Wang X, et al. Apple rootstocks with different phosphorus efficiency exhibit alterations in rhizosphere bacterial structure[J]. Journal of applied microbiology, 2020, 128(5): 1460-1471.
案例4:
发表期刊:LWT
影响因子:6.0
发表时间:2019

Fig. 5. Fungal diversity in the GL, PO and PL at class (A), genus (B) and species (C) levels. Circular representation of fungi community in different containers (PO, GL and PO) at genus level (D). The data was visualized via Omicshare (http://www.omicshare.com/tools).
引用方式:
Pearson's correlation analysis and Circos graph were performed using the OmicShare tools, a free online platform for data analysis (http://www.omicshare.com/tools).
参考文献:
Liu L, She X, Qian Y, et al. Effect of different fermenting containers on the deterioration of Sichuan pickle[J]. LWT, 2019, 111: 829-836.