


 扫码支付更轻松

输入
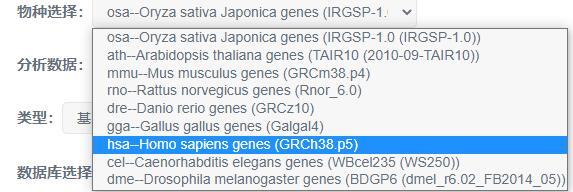
1 物种选择
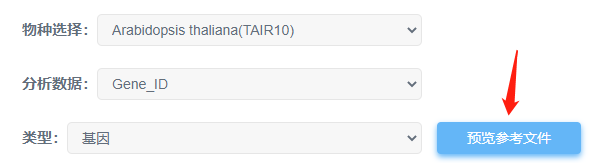
以转录组测序获取的,人的基因表达量表为例 (用户可依据自己研究的物种勾选)
2 版本及分析数据选择
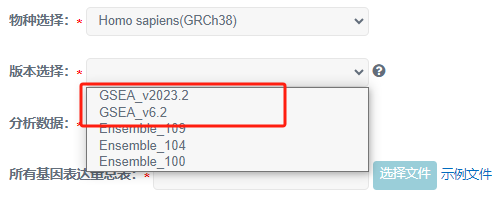
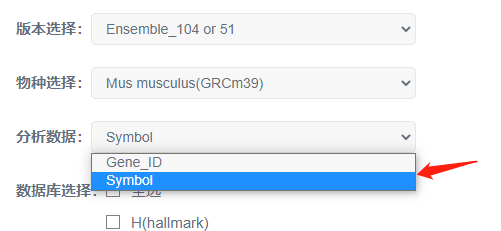
本示例中,预定义基因集文件中,基因名称为基因的Symbol号,因此版本需要选择GSEA数据库版本。
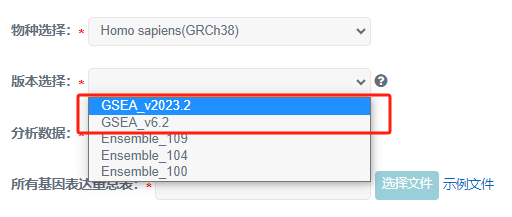
此时,分析数据自动填选为基因symbol号。
3 预定义基因集文件
3.1 预定义基因集
预定义基因集为要分析的未知功能的基因集。文件具体要求如下:输入的表格文件支持txt(制表符分隔)文本文件、csv(逗号分隔)文本文件、以及Excel专用的xlsx格式,同样支持旧版Excel的xls(Excel 97-2003 )格式。
第一列为Gene_ID命名方式,后续为样本名称及对应的表达量,仅可分析两组样本;数字之间,列和列之间分隔用Tab。示例文件如下:
|
Gene Name |
ALL_1 |
ALL_2 |
ALL_3 |
AML_1 |
AML_2 |
AML_3 |
|
TACC2 |
|
|
|
|
|
|
|
DYT1 |
|
|
|
|
|
|
|
32385_at |
|
|
|
|
|
|
3.2 分组文件
分组文件用于描述预定义基因集内样本的分组情况。文件具体要求如下:
输入的表格文件支持txt(制表符分隔)文本文件、csv(逗号分隔)文本文件、以及Excel专用的xlsx格式,同样支持旧版Excel的xls(Excel 97-2003 )格式。
文件第一列为样本名,第二列为所在的组名。注意:即使没有实验重复,依然需要填写这个文件(一个样本为一组)。数字之间,列和列之间用“Tab”分隔,示例文件如下:
|
ALL_1 |
ALL |
|
ALL_2 |
ALL |
|
ALL_3 |
ALL |
|
AML_1 |
AML |
|
AML_2 |
AML |
|
AML_3 |
AML |
3.3 比较组文件
定义分组信息。文件具体要求如下:
输入的表格文件支持txt(制表符分隔)文本文件、csv(逗号分隔)文本文件、以及Excel专用的xlsx格式,同样支持旧版Excel的xls(Excel 97-2003 )格式。
数据整理时,需按照对照组在前,处理组在后的格式。如第一列是ALL(对照组),第二列是AML(处理组)。比较时,以处理组比较对照组。示例文件如下:
|
ALL |
AML |
4 参数选择
本示例中,所有参数选择均按照推荐或默认勾选。
输出
1. 图形预览
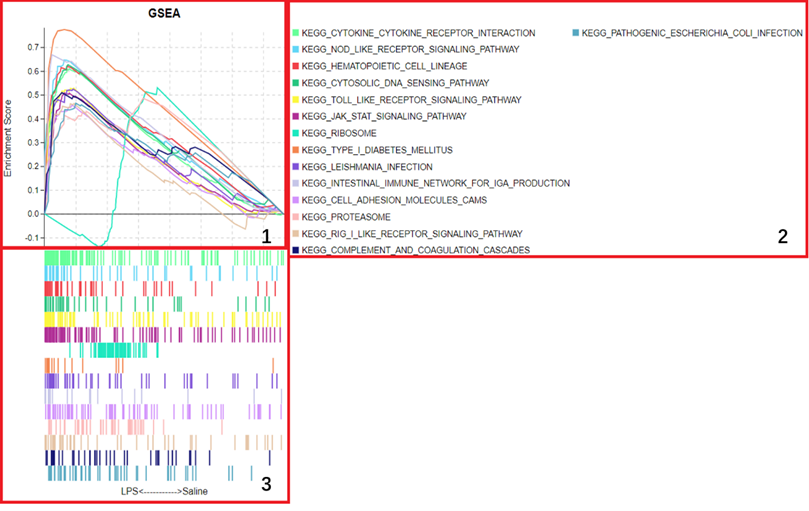
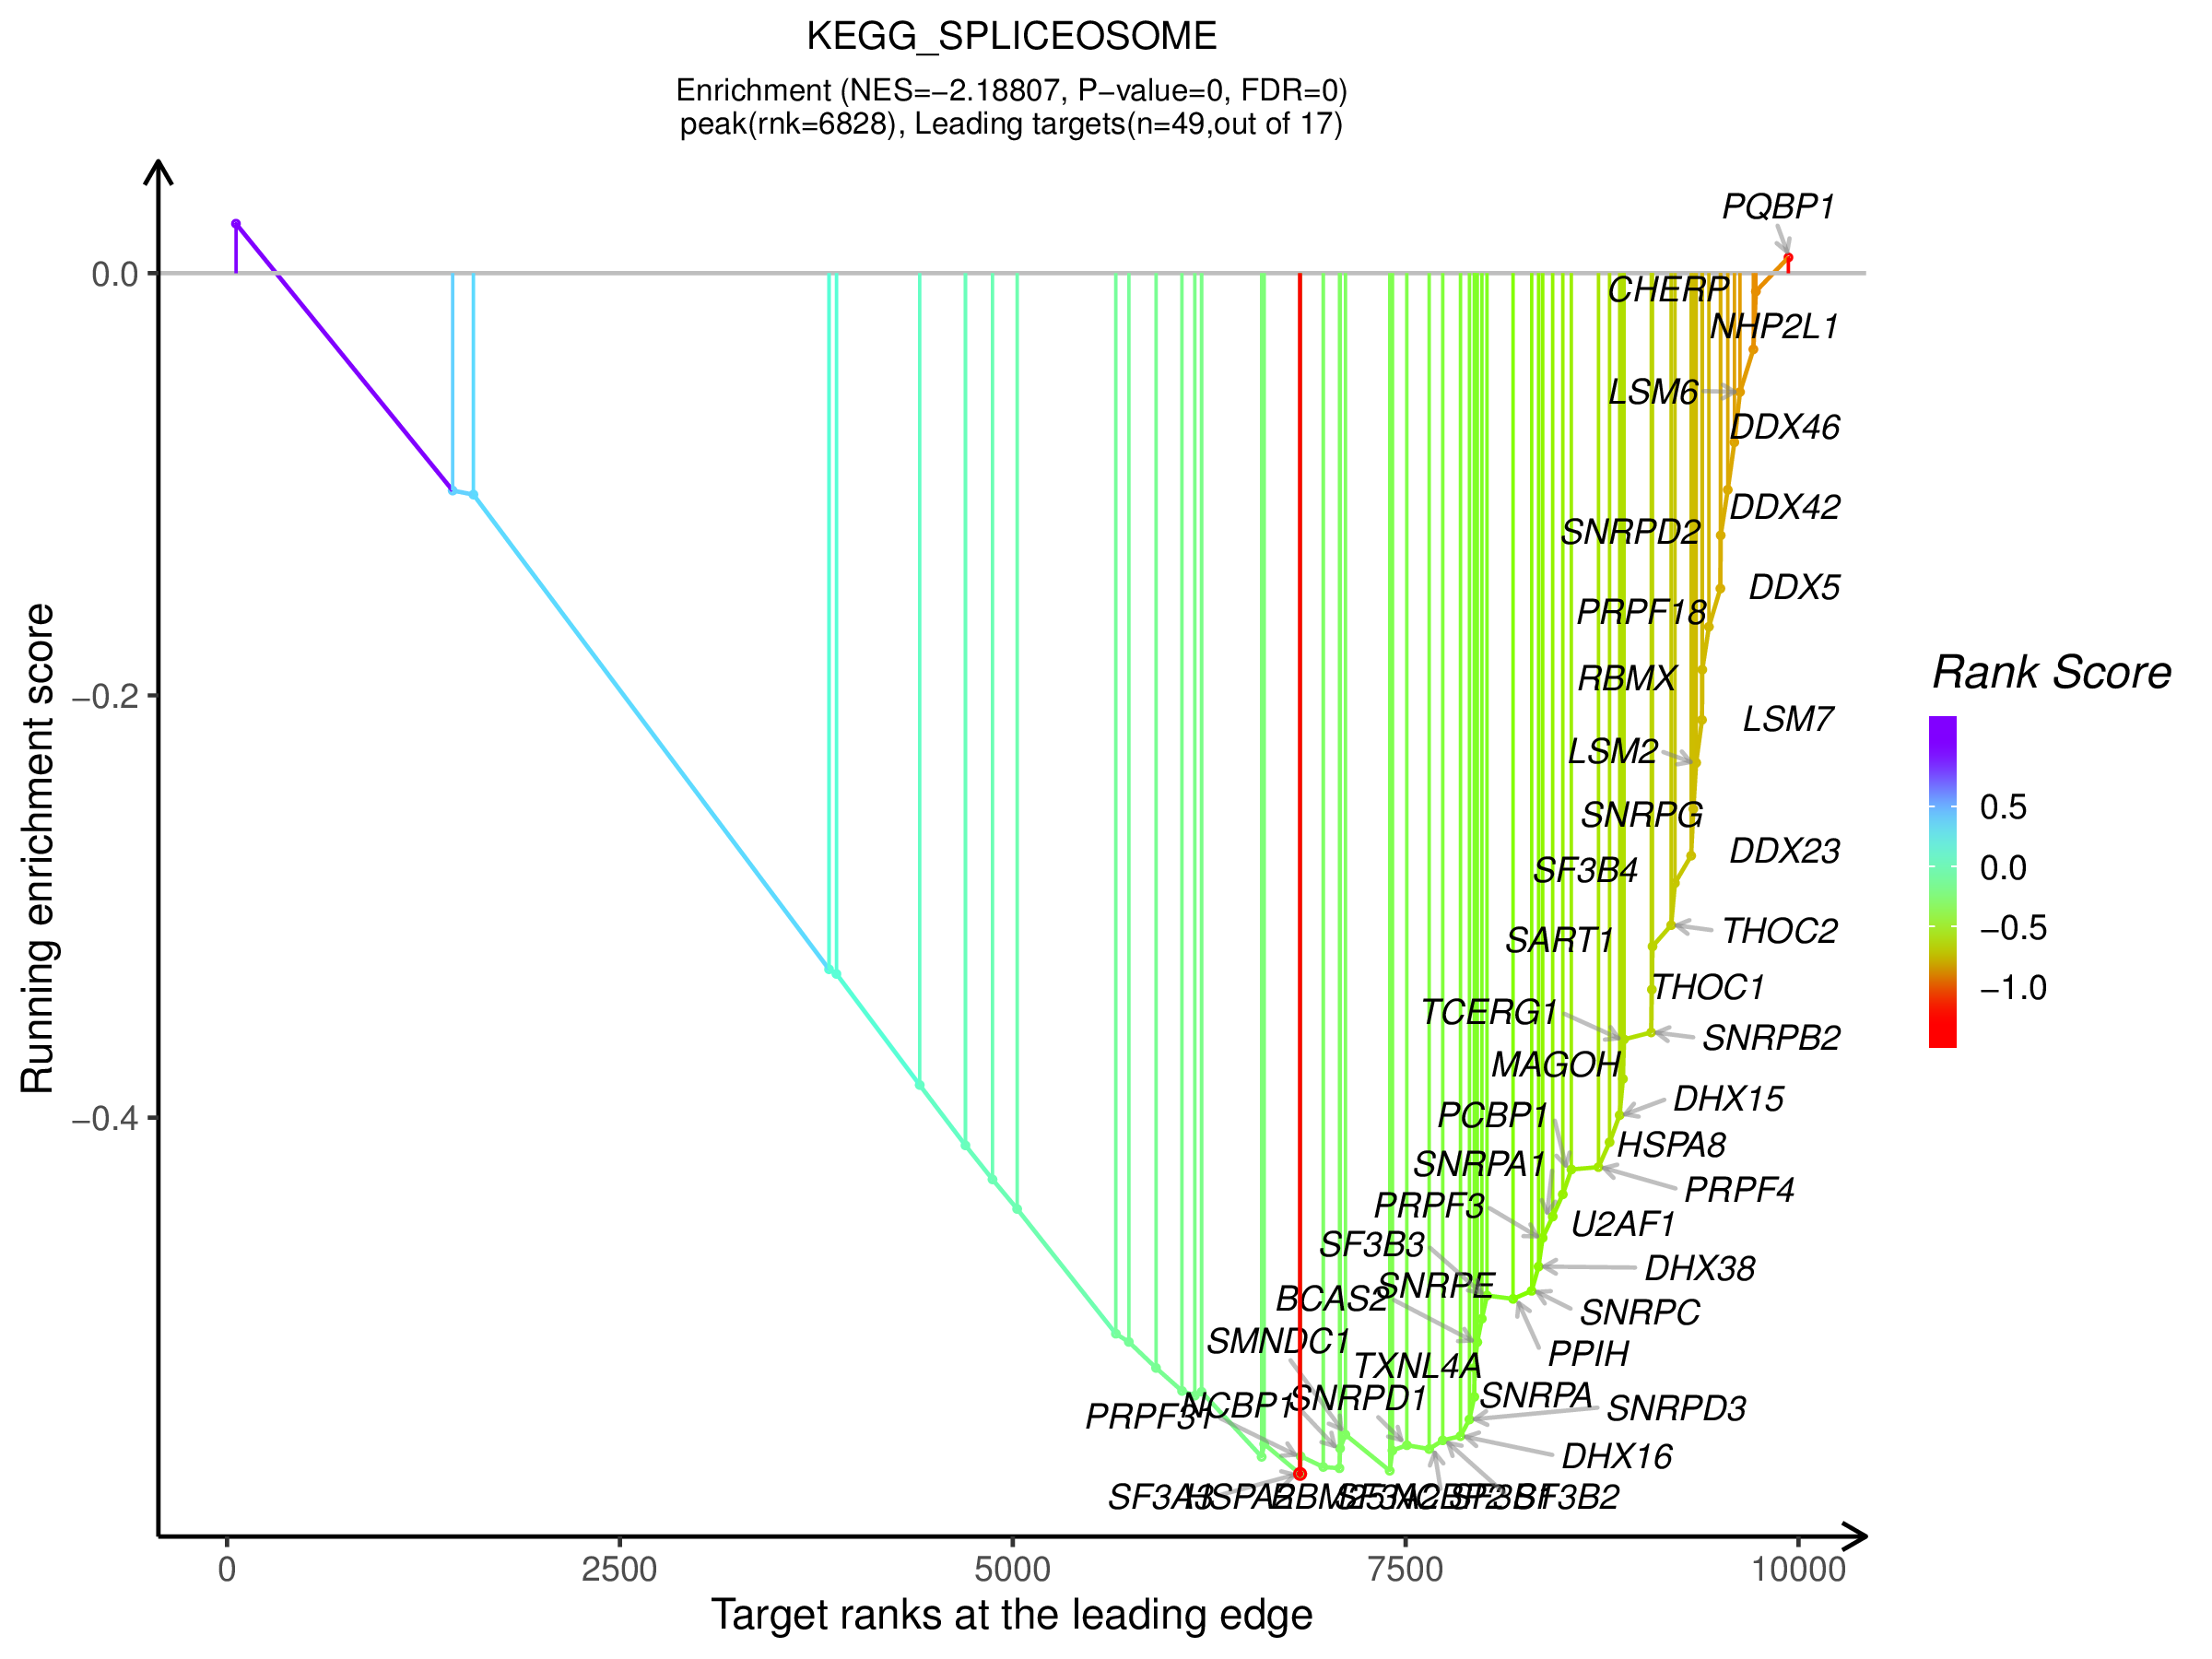
1、预定义基因集在不同功能单位中(通路,GO term或其他)ES值累加过程中的增减变化曲线,不同功能单位中用颜色区分,可同时对比多条通路的ES值,帮助用户快速锁定目标通路。
2、功能单位(通路,GO term或其他)全称
3、预定义基因集成员在功能单位中的位置,图形下方展示实验组与对照组的分布方向
2. 结果文件
(1)ALL-vs-AML.c3.mir.Gsea:结果文件夹,“c3”为选择的数据库程序根据输入的文件和选定的参数输出GSEA软件原始分析结果,可查看显著富集的TOP N的通路ES图及leading edge等信息。点击文件夹内的“ ”,以网页形式查看总览结果。
(2)ALL-vs-AML.c3.mir.Gsea:以表格的形成输出GSEA富集结果
2.1结果解读
2.1.1 表格解读
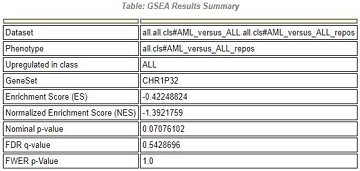
表头:GSEA结果总览
Upregulated in class:该基因集在某一分组中高表达(如:表格表示在ALL组中高表达)
GeneSet:在进行比对得分时,预先生成的基因集
Enrichment Score(ES):自定义基因集在预先生成的基因集中的富集分数
Normalized Enrichment Score:归一化后的ES值
Nominal p-value:置换检验得到的P值,判断结果可信度;
FDR q-value:多重假设检验FDR方法校正后的p值;
FWER p-Value:Bonferonni校正后的p值;
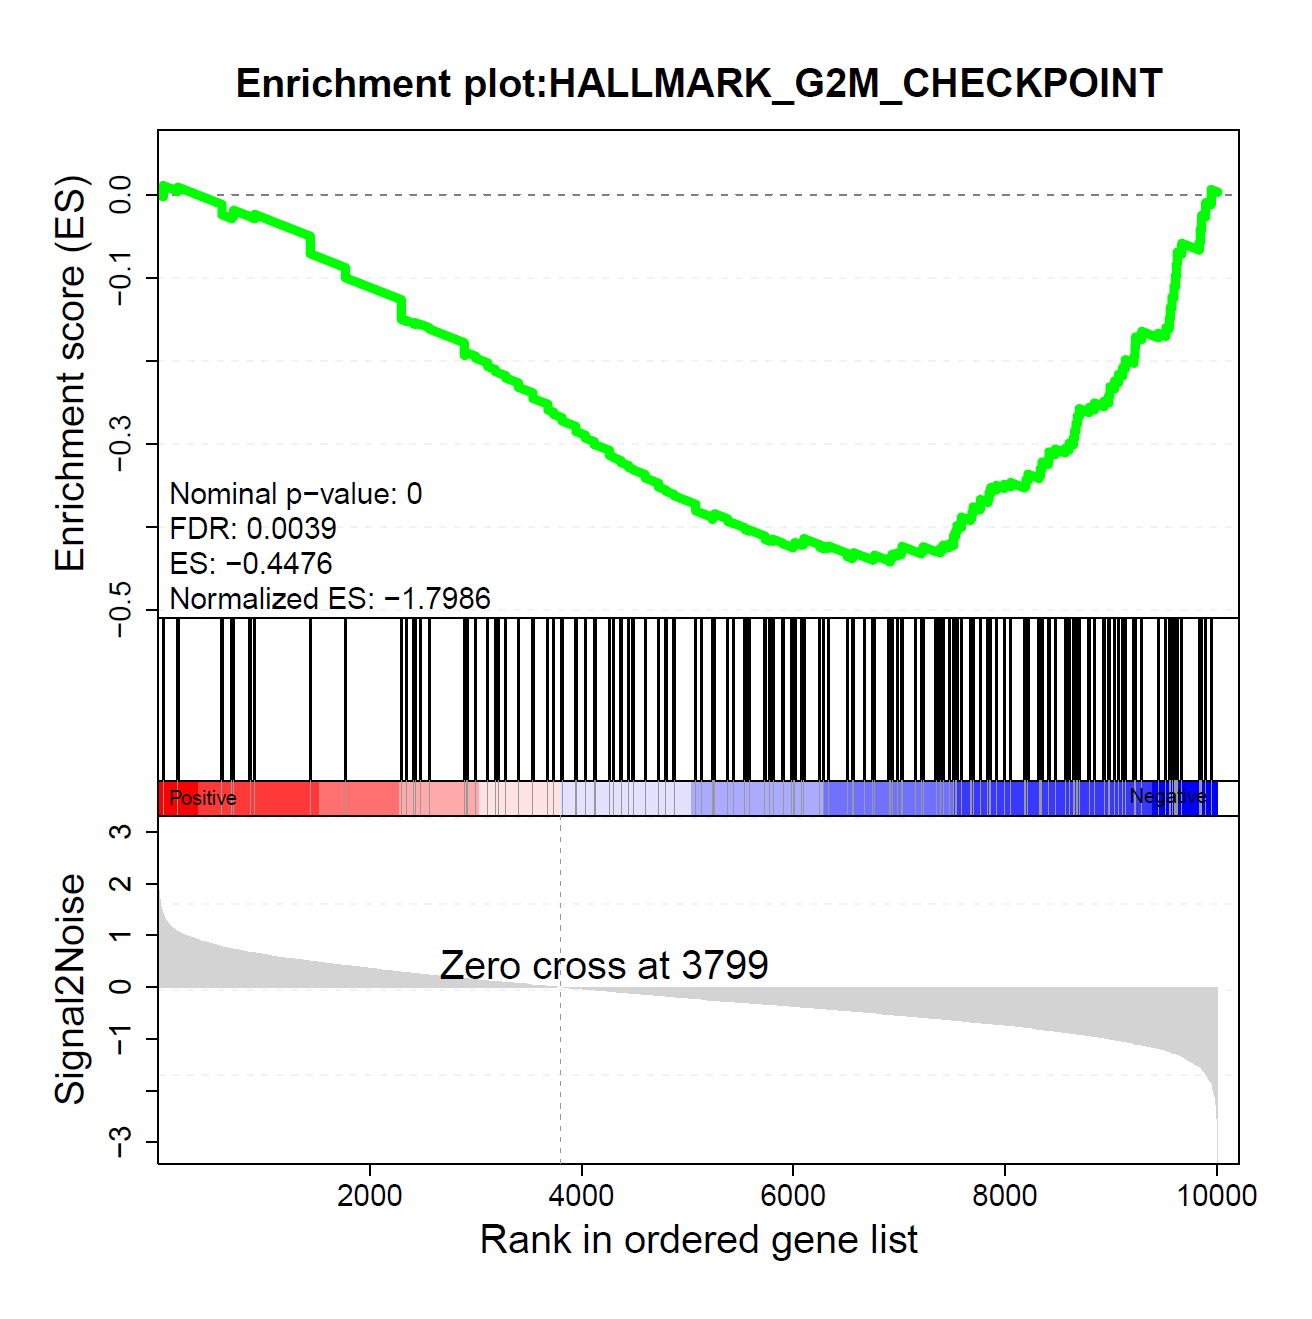
2.1.2 ES图解读
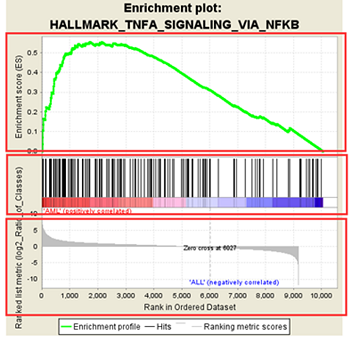
上方红框:ES值累加过程中的增减变化曲线;
中间红框:目标基因集成员(黑色竖线标识)在所有基因排序中的位置;
下方红框:按指标从高到低排序的基因,指标的真实值(这里为差异倍数的log2值)
2.1.3 GSEA详细结果解读
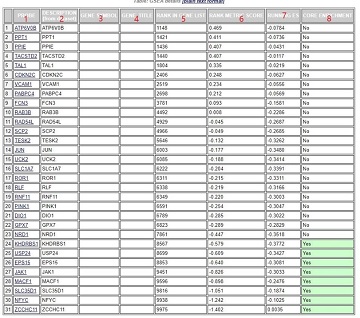
第1列:基因名称;
第2列:来自于基因集中的基因名称;
第5列:该基因在自定义排序列表中的位置
第6列:该基因排序量的比值,如foldchange值
第7列:积累的ES值
第8列:该基因是否属于核心基因,“Yes”表示对该基因集的ES做出了主要贡献的基因
2.1.4 热图结果解读
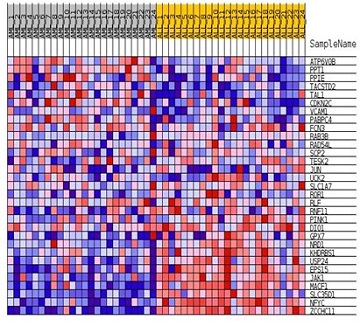
该图展示的是位于该基因集下的基因在所有样本表达量的分布。每一列代表一个样本,每一行代表一个基因,基因表达量从低到高,颜色表达量从蓝色过渡到红色。
2.1.5 表格结果解读
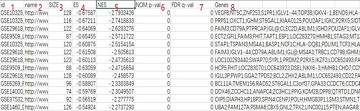
第1列:基因集名称
第2列:链接,复制至网页打开可进入基因集的详细信息
第3列:基因集里的基因数
4~5列:富集分数ES值,以及校正后(Z score法)的ES值
第6列:原始P值;
第7列:用FDR法矫正后的p value,即Q value
第8列:富集在该基因集中的基因名称
了解GSEA工具原理及详细解析,请点击
https://www.omicshare.com/forum/thread-5044-1-1.html
1. 功能
依赖固定阈值法筛选出的差异基因,往往会将变化较为微弱的基因筛除,使得差异基因数目很少,离散在各种通路中,出现无法明晰某个基因集对表型的贡献。GSEA分析(Gene Set Enrichment Analysis)不会对基因预过滤,能更全面的对某一功能单位(通路,GO term或其他)的调节作用进行解释。
动态GSEA分析,不仅保留了原始ES图,在ES图下方整合热图,可同时展现预定义基因集在不同功能单位(通路,GO term或其他)中的分布情况和ES积分,供用户快速筛选目标功能单位。
2. 物种选择
可对18个常见物种进行富集分析,牛、斑马鱼、人、猕猴、小鼠、大鼠、猪、秀丽线虫、果蝇、拟南芥、水稻、番茄、小麦、玉米、酵母、山羊、鸡、籼稻,并且提供2个基因组版本;
3、分析数据
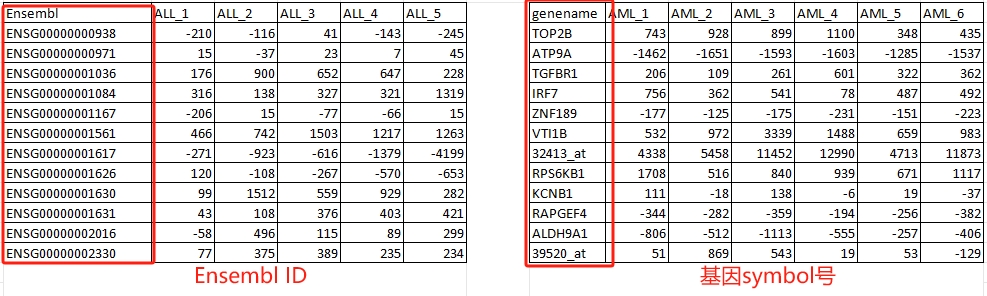
1.基因数据类型支持:基因ID号(Ensembl id);其中人和小鼠支持 基因Symbol号 及 基因ID号(Ensembl id)两种。
2.其余16个常见物种(除人和小鼠以外),如果数据为gene name等,需要先转换成 基因ID号(Ensembl id)。
附:以人为例,Ensembl ID 跟 基因symbol号区别:
4、版本 及 数据库选择
GSEA是一种基于基因集的富集分析方法。基因集是事先根据功能或者其他一些原理把很多的基因分类成不同的基因集合。一个基因集可以是某个通路或者go term中的所有基因。基迪奥依据使用者提供的分析数据不同,提供了不同的基因集选择。
由于每个数据库收录的研究物种不同,勾选不同物种时对应版本及检索的数据库也不同。
1)当分析数据为基因Symbol号(人和小鼠可选),版本需要选择GSEA版本(GSEA_v2023.2 或 GSEA_v6.2)。
数据库则可在MSigDB数据库中依据需要进行选择。MSigDB数据库是GSEA官网提供的基因集数据库,其中包含了8种分类模式:
H:由多个已知的基因集构成的超基因集;
C1:包含人类每条染色体上的不同cytoband区域对应的基因集合。根据不染色体编码进行二级分类
C2:已知数据库基因集合集
C3:包含miRNA靶基因和转录因子结合区域等基因集合
C4:包含计算机软件预测出来的基因集合,主要是和癌症相关的基因
C5:GO基因集
C6:癌基因集
C7:免疫基因集
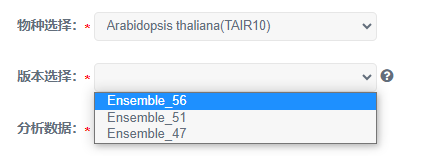
2)当分析数据为基因ID号时,版本需要选择Ensembl相关版本。
可勾选KEGG、GO、DO、Reactome四种数据库。
其中DO数据库主要用于描述基因功能与疾病的相关信息,目的是为生物医学界提供一致的人类疾病术语、表型特征和相关医学词汇疾病概念,是主要适用于人的数据库,当物种选择“人”时,可勾选DO数据库,选择其他物种时则不可勾选。
Reactome数据库汇集了人类各项反应及生物学通路的数据库,目前数据库已更新,增加了大小鼠等动物物种信息,但植物物种仍未收录,因此选择物种为植物时不能勾选此数据库。
5. 所有基因表达量总表
由于在所有样本中表达量都为0的基因,无法满足后续的排序,建议该表格应为:去掉所有样本里表达量为0的基因之后,获得的表格。
6. 分析参数选择
6.1所有基因排序方式
可选择以下方式分别计算各基因的数值,并依据数值对基因进行排序:
Signal2Noise:用差值/标准差进行归一化校正:
T-test:组间T检验:
Ratio_of_Classes:组间表达量的比值,即差异倍数:
Log2_Ratio_of_clase:表达量差异倍数,取log值:
6.2 基因集范围
若功能基因集基因数目小于(默认15)或者大于(默认500)设定阈值则会过滤掉,不参与分析。
6.3 输出ES图数量
根据设定数字输出分析ES图,默认输出前20条通路结果。GSEA软件默认采用p-value<0.05,q-value<0.25作为显著性阈值。为了更快速的获得分析结果,自定义的范围值设置在100以内。
6.4 是否绘制GSEA点阵图
绘制GSEA点阵图的数量与ES图的数量一致。点阵图样式如下图所示。
7. 图形修改
7.1数据库修改
点击 更换不同数据库,展示预定义基因集在不同数据库中的ES图。
7.2 ES 动态总览图
点击 可对图形进行调整,实现图表交互功能。 点击“
 ”放大图形,点击“
 ”缩小图形,该变化仅针对视图效果改变,对导出图形的大小无影响;点击“
 ”可展开图形全局修改,对图形细节进行个性化修改,包括颜色、标题、字体、图形透明度等;点击“
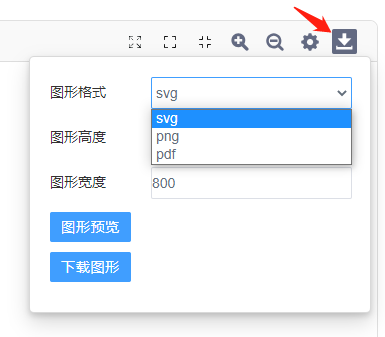
 ”可导出图形,在此处可修改图片格式(svg格式、png格式)和设置图形大小(单位为px),点击“图形预览”,可以对图形进行预览,点击“下载图片”可下载图片至浏览器默认下载位置。
Q1. GSEA运行出错:
①物种选错;
②版本选择错误。物种为智人或小鼠时,提供基因symbol号及Ensembl ID两种分析数据。其中symbol号对应GSEA_v2023.2相关版本;Ensembl ID对应Ensembl相关版本。请仔细根据实际表格数据进行选择。
③分组不能用空格,请删掉或用下划线代替;
④工具使用一次,只能进行一对比较,即比较组只有一组。
⑤表达量文件中第一列gene id 类型跟平台提供的不一致;可以点击“预览参考文件”参考平台的gene id类型(一般是ensembl id);
Q2. 为什么提示完成,下载却没有图片?
下载无结果,可能原因是分析数据类型选错或者数据错误(比如表达量数据中掺杂里些英文字符串等)。
其中GSEA工具中人、小鼠分析数据可使用symbol及相关数据库;如果表达量文件中,geneid为gene name,则“分析数据”需要选择symol。
Q3. 比较组应该怎么整理?
数据整理时,需按照对照组在前,处理组在后的格式。比较时,以处理组比较对照组。
如示例:

第一列是ALL(对照组),第二列是AML(处理组)
Q4. 提交时报错常见问题:
1.提交时显示X行X列空行/无数据,请先自查表格中是否存在空格或空行,需要删掉。
2.提交时显示列数只有1列,但表格数据不止1列:列间需要用分隔符隔开,先行检查文件是否用了分隔符。
其它提示报错,请先自行根据提示修改;如果仍然无法提交,可通过左侧导航栏的“联系客服”选项咨询OmicShare客服。
Q5.下载图片不清晰?
动态GSEA工具通过“跳转查看”可前往动态调整窗口,点击“下载”,同时提供位图(png)和矢量图(pdf、svg)三种类型的图片下载。
您可以通过调整“图形高度”、“图形宽度"提高下载图形的像素;亦可直接下载矢量图(svg或pdf),矢量图可以无限放大、不会模糊。
Q6.结果图片可以修改吗?如何修改?
可以。前往在线修改窗口方式如下:
①当前工具页——下拉”结果显示“——选择需要调整的项目编号,即可打开任务进行调整。
②任务完成后会自动跳转”我的项目“(左侧菜单栏亦可前往)——找到任务——选择第三个小图标”跳转查看“,即可前往修改。

Q7.如何选择想要展示的功能单位(Pathway,GO Term或其他基因集)?
动态调整窗口,下拉表格勾选相关功能单位,即可展示绘制。
引用OmicShare Tools的参考文献为:
Mu, Hongyan, Jianzhou Chen, Wenjie Huang, Gui Huang, Meiying Deng, Shimiao Hong, Peng Ai, Chuan Gao, and Huangkai Zhou. 2024. “OmicShare tools: a Zero‐Code Interactive Online Platform for Biological Data Analysis and Visualization.” iMeta e228. https://doi.org/10.1002/imt2.228案例1:
发表期刊:Journal of Cellular Physiology
影响因子:5.6
发表时间:2022
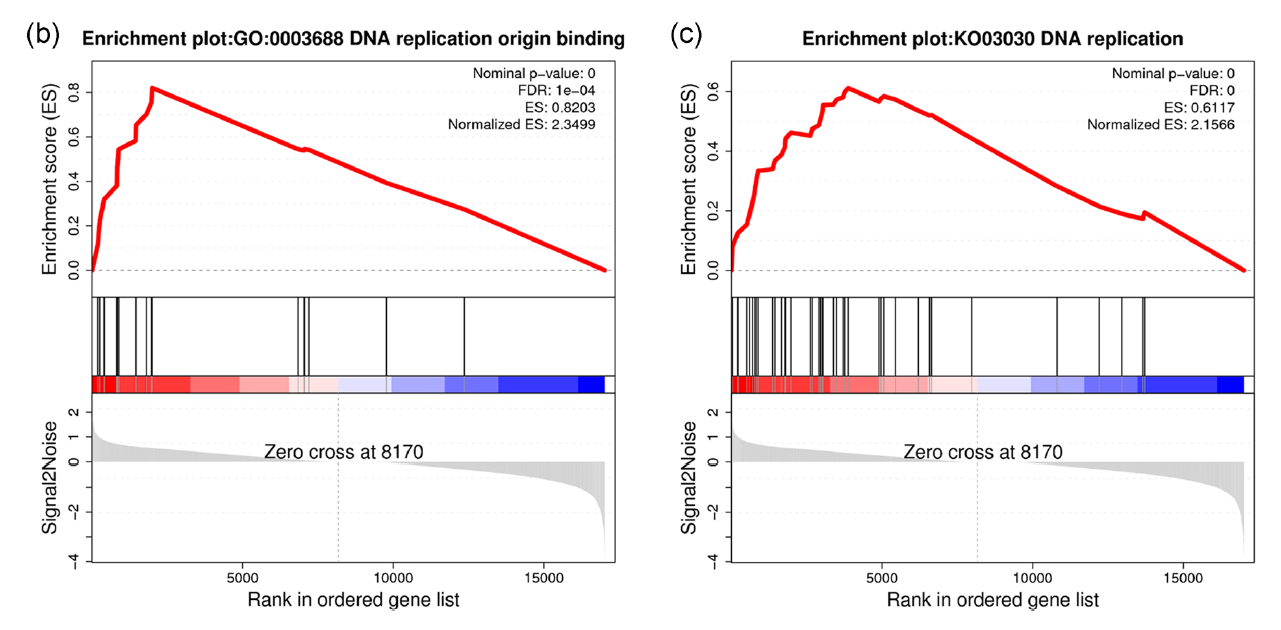
FIGURE 5 Enrichment analysis identifies Schwann cell subtype characteristics. (b,c) GSEA enrichment plots of Schwann cell subtype 3 compared with other Schwann cell subtypes for the (b) Gene Ontology (GO) term DNA replication origin binding and (c) Kyoto Encyclopedia of Genes and Genomes (KEGG) pathway DNA replication
引用方式:We thank GENE DENOVO Company for bioinformatics analysis support with OmicShare Analysis Platform (http://www.omicshare.com/tools).
参考文献:
Zhang R, Chen Q, Huang L, et al. Single‐cell analyses reveal the differentiation shifts of Schwann cells in neonatal rat sciatic nerves[J]. Journal of Cellular Physiology, 2022, 237(1): 637-646.
案例2:
发表期刊:Ecotoxicology and Environmental Safety
影响因子:6.8
发表时间:2023
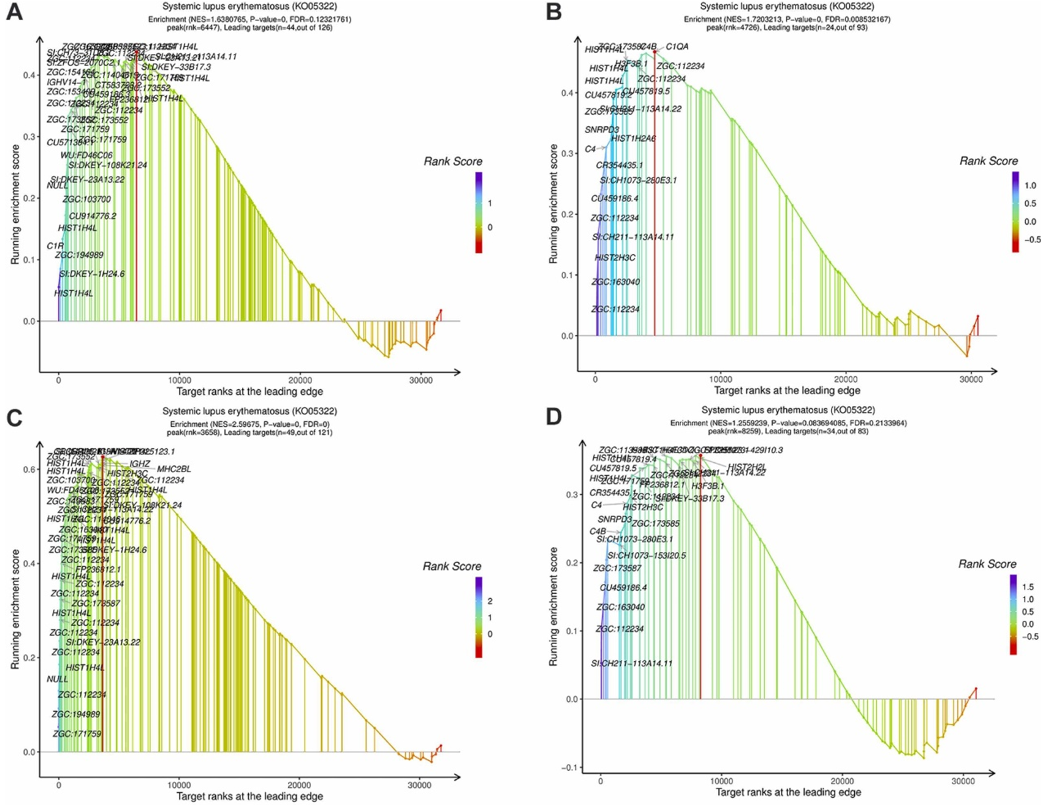
Fig. 7. The gene expressions of systemic lupus erythematosus term (ko05322) in GSEA analysis. GSEA enrichment diagram of systemic lupus erythematosus in experiment A (AC). GSEA enrichment diagram of systemic lupus erythematosus in experiment B (BD).
引用方式:
The sort order of all genes was set up as Signal2Noise method. Other parameter settings were default values. GSEA was performed using OmicShare tools (https://www.omicshare.com/tools).
参考文献:
Yu H, Song W, Chen X, et al. Transcriptomic analysis reveals up-regulated histone genes may play a key role in zebrafish embryo-larvae response to Bisphenol A (BPA) exposure[J]. Ecotoxicology and Environmental Safety, 2023, 252: 114578.
案例3:
发表期刊:Cell Death & Disease
影响因子:9.0
发表时间:2023
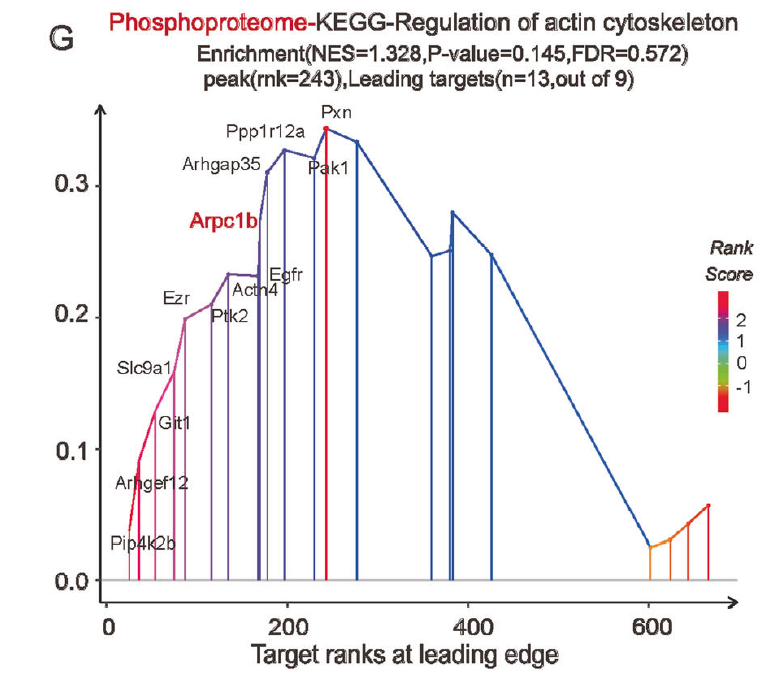
Fig. 4 Transcriptional trajectories from healthy to injured PTCs and proteomics analysis revealed extensive cytoskeletal remodeling events in AKI-PTCs. G GSEA analysis of differentially expressed proteins in the phosphoproteomics, and the most significantly enriched pathway in the KEGG was the regulation of actin cytoskeleton pathway, in which Arpc1b is also involved.
引用方式:
Gene enrichment analysis is a combination of GO and KEGG, using the clusterProfiler package and the Omicshare platform (https://www.omicshare.com/) for Gene Set Enrichment Analysis (GSEA) analysis.
参考文献:
Chen Z, Li Y, Yuan Y, et al. Single-cell sequencing reveals homogeneity and heterogeneity of the cytopathological mechanisms in different etiology-induced AKI[J]. Cell Death & Disease, 2023, 14(5): 318.
案例4:
发表期刊:Animals
影响因子:3.0
发表时间:2022
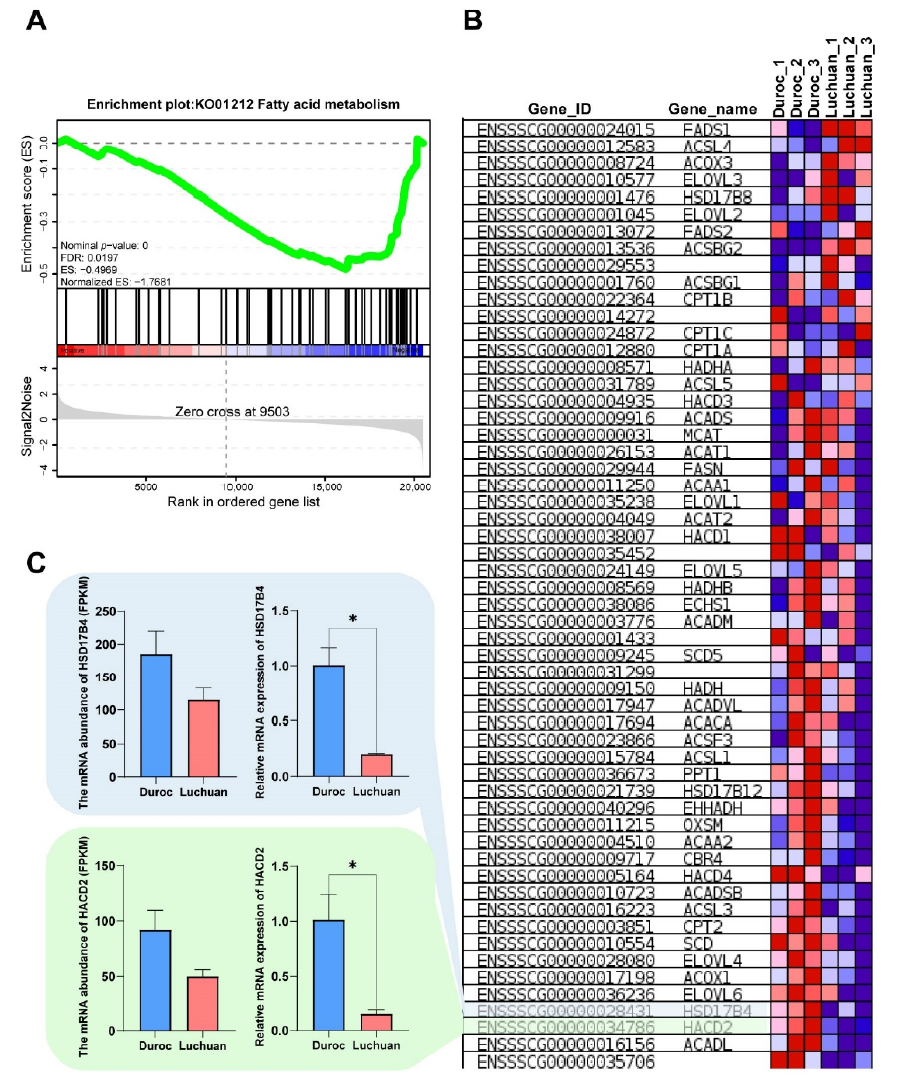
Figure 4. Functional gene screening and functional verification. (A) GSEA-KEGG analysis of the transcriptome. A pathway of positive enrichment score is up-regulated, whereas a pathway of negative enrichment score is down-regulated. (B) Gene expression heatmap of the fatty acid metabolic pathway. The color key (from blue to red) of abundance value indicated low to high expression levels.
引用方式:
Gene expression level was measured by Fragments per Kilobase per Million Mapped Fragments (FPKM) [17], the most commonly used method for estimating gene expression abundance. DEGSeq [18] was used to analyze DEGs (|Fold Change| > 2 and p-value < 0.01).The Principal Component Analysis (PCA), Gene Ontology (GO) term enrichment analysis, Kyoto Encyclopedia of Genes and Genomes (KEGG) pathway enrichment analysis and GSEA were performed using Omicshare, a real-time interactive online data analysis platform (p-value < 0.05) (http://www.omicshare.com (accessed on 18 February 2022)) [19].
参考文献:
Pan H, Huang T, Yu L, et al. Transcriptome Analysis of the Adipose Tissue of Luchuan and Duroc Pigs[J]. Animals, 2022, 12(17): 2258.
案例5:
发表期刊:PeerJ
影响因子:2.7
发表时间:2022
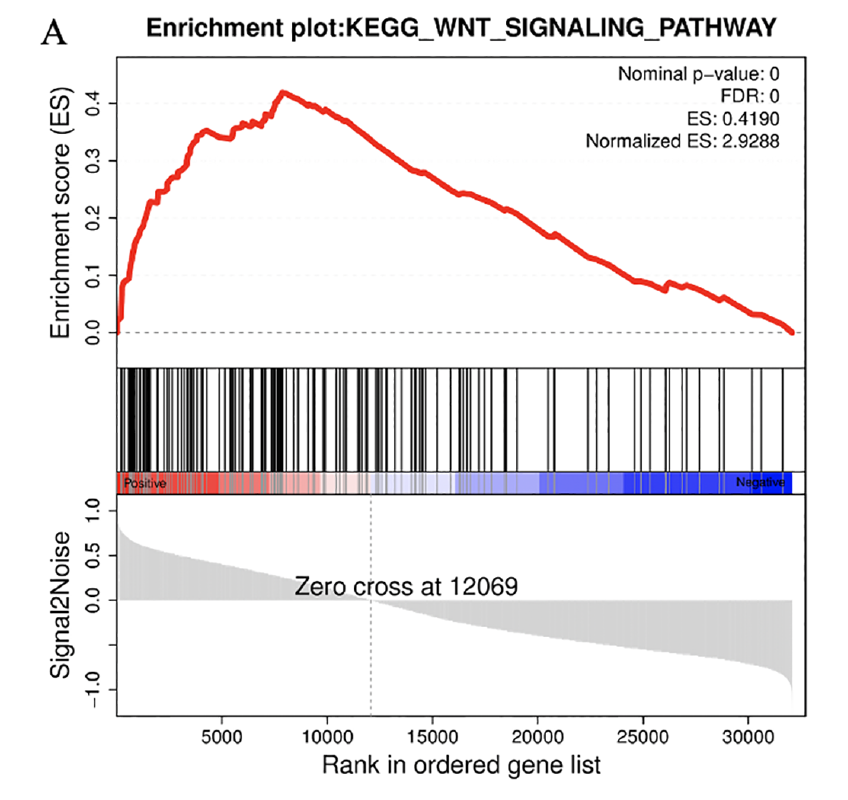
Figure 5 GSEA analysis of pathways genes derived from CaOx stones and Control patients mostly involved in. (A) GSEA analyses indicated that Control group was significantly correlated with the WNT signaling pathway in GSE73680 datasets.
引用方式:
GO and KEGG analysis were applied through Omicshare Tools (https://www.omicshare.com/tools/). Protein-protein interactions was explored via the STRING database. Gene Set Enrichment Analysis (GSEA) was conducted by Omicshare Tools and the venn diagram was conducted through (http://bioinformatics.psb.ugent.be/research).
参考文献:
Yang Y, Hong S, Lu Y, et al. CAV1 alleviated CaOx stones formation via suppressing autophagy-dependent ferroptosis[J]. PeerJ, 2022, 10: e14033.