


 扫码支付更轻松

原理:
在生物体内,不同基因相互协调行使其生物学功能,基于Pathway的分析有助于更进一步了解基因的生物学功能。KEGG是有关Pathway的主要公共数据库。 Pathway显著性富集分析以KEGG Pathway为单位,应用超几何检验,找出与整个基因组背景相比,在差异表达基因中显著性富集的Pathway。
P的计算公式 :

其中,N为所有基因(背景基因)的数量,n为差异基因(目的基因)的数量,M为所有基因中该pathway的数量,i为差异基因中注释到该pathway的数量,计算得到的pvalue通过FDR校正之后,以corrected-pvalue≤0.05为阈值,满足此条件的pathway定义为在差异表达基因中显著富集的pathway。
功能:
输入目的基因、代谢物列表(常见为差异基因或差异代谢物),通过预设定参数,进行KEGG富集分析并将分析结果进行精美图形可视化,输出图形有富集气泡图、富集条形图、富集圈图、z-score气泡图
适用范围:
可对18个常见物种的基因集进行富集分析,牛、斑马鱼、人、猕猴、小鼠、大鼠、猪、秀丽线虫、果蝇、拟南芥、水稻、番茄、小麦、玉米、酵母、山羊、鸡、籼稻,并且提供2个基因组版本;
也可以自行准备研究物种的背景基因进行富集分析。
数 据 整 理
数据类型:基因
1. 输入的表格文件,支持txt(制表符分隔)文本文件、csv(逗号分隔)文本文件、以及Excel专用的xlsx格式,同样支持旧版Excel的xls(Excel 97-2003 )格式。
2. 输入文件1——富集的目的基因列表,即想要研究的基因列表:
第一列为基因id(必填),第二列可以为差异表达倍数(可选输入,不包含log2fc则无法绘制富集差异z-score气泡图),具体请查看示例文件格式。
目的基因要包含在背景基因表中。需添加列名。
3.输入文件2——背景基因总表,即所有基因的列表:
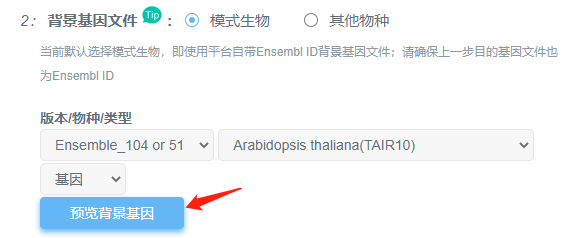
①如果是平台有提供背景文件的上述18种常见物种,可以直接选用平台提供的背景;注意点击“预览背景基因”查看基因ID类型是否与平台一致,不一致,需要先进行转换。
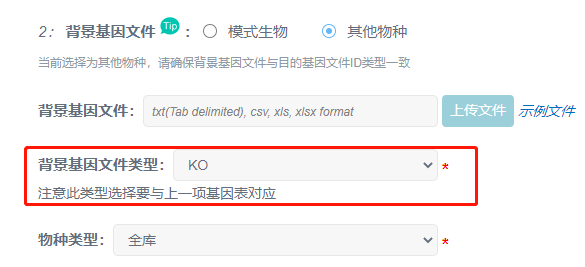
②不是上述18种常见物种,或基因ID类型不一致且无法转换,需要选“其他物种”,上传自备的背景文件。背景文件第一列为基因id,第二列为用于获取pathway的一个id,类型有4:
类型1:KO号,例如K10942,必须为基因大K号(K number)
类型2:ncbi-geneid,例如18053,即ncbi上得到的geneid,一连串数字组成。
类型3:kegid,例如mmu:18053,即KEGG官网上的id,可以通过KEGG注释或者KEGG官网获得
类型4:kopath,为本公司提供的类型文件,第一列为基因id,第二列为KO号,第三列为通路编号,以“,”分隔,第4列为kegid。
数据类型:代谢物
①目的代谢物文件:格式同目的基因文件。
② 背景代谢物文件:
类型1:C number, 表格由代谢物id和C number(KEGG COMPOUND Database entry id,例如C00047)这两2组成。
类型2:pathway num,表格由代谢物id、C number和pathway number(5位数字,pathway id去掉前面的字母,如00020)。
注意,同样的数据,选择类型1会富集到更多的pathway条目,注意删除不属于当前物种的pathway。
1. 总览

2. 结果统计表

3. 数目统计图
4. 显著性柱状图

5. 显著性气泡图

6. 显著性通路图

7. 富集圈图
Q1. 为什么使用平台背景基因,任务出错?
在提交之前,强烈建议大家在选择号物种/版本/类型后点击“预览背景基因”,查看平台提供的基因跟目的基因类型是否相同。
常见出错类型:
①平台提供的是Ensembl ID,但是目的基因表是symbol或其他id类型,则需要对目的基因进行基因ID转换;
PS:基因ID转换工具教程
②Ensembl id的结构是“物种前缀+序列类型+数字”Ensembl ID 后面的”小数”部分为版本号,如ENSG00000121410.11,小数部分的版本号必须删除。
Q2. 为什么按照示例文件整理背景基因,却出错?
背景基因的类型一般有3种,包括kegid、ncbi-geneid、KO号。只需要准备一列gene id ,一列kegid/ncbi-geneid/KO号即可。一般较常用到的是KO号。
① 注意这里的KO号是指KEGG Orthologs,即基因大K号(如:K10942),而不是KEGG Ontologs(如KO352);
②如下图,含有过多注释信息容易导致运行出错,这里,我们只需要保留gene id 及 k号即可。

③注意类型参数是否跟准备的文件一致。
Q3. 提交时报错常见问题:
1.提交时显示X行X列空行/无数据,请先自查表格中是否存在空格或空行,需要删掉。
2.提交时显示列数只有1列,但表格数据不止1列:列间需要用分隔符隔开,先行检查文件是否用了分隔符。
其它提示报错,请先自行根据提示修改;如果仍然无法提交,可通过左侧导航栏的“联系客服”选项咨询OmicShare客服。
【关于结果的常见问题】
Q4.为什么结果中 p value 全为1:
pvalue全为1,基本是目的基因数目与背景基因数目完全一样所致。注意,富集分析中的背景基因是当前物种所有基因的列表。
Q5. 为什么代谢通路图中会出现半绿半红的框?
一半红一半绿的框表示多个基因都属于这个基因家族,其中一个基因表达上调,另一个基因表达下调。
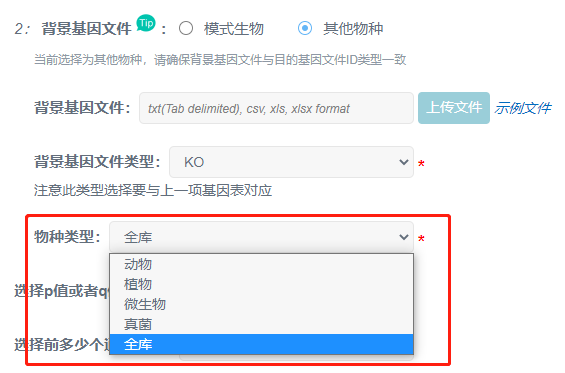
Q6.为什么pathway注释统计图中有不属于我物种的分类?比如我分析的物种是植物,却出现了人相关的分类名?
这是因为在选择参数时,物种类型选择了“全库”,可以根据物种进行类型选择;或者去掉不相关的分类名称。
引用OmicShare Tools的参考文献为:
Mu, Hongyan, Jianzhou Chen, Wenjie Huang, Gui Huang, Meiying Deng, Shimiao Hong, Peng Ai, Chuan Gao, and Huangkai Zhou. 2024. “OmicShare tools: a Zero‐Code Interactive Online Platform for Biological Data Analysis and Visualization.” iMeta e228. https://doi.org/10.1002/imt2.228案例1:
发表期刊:Signal Transduction and Targeted Therapy
影响因子:39.3
发表时间:2022
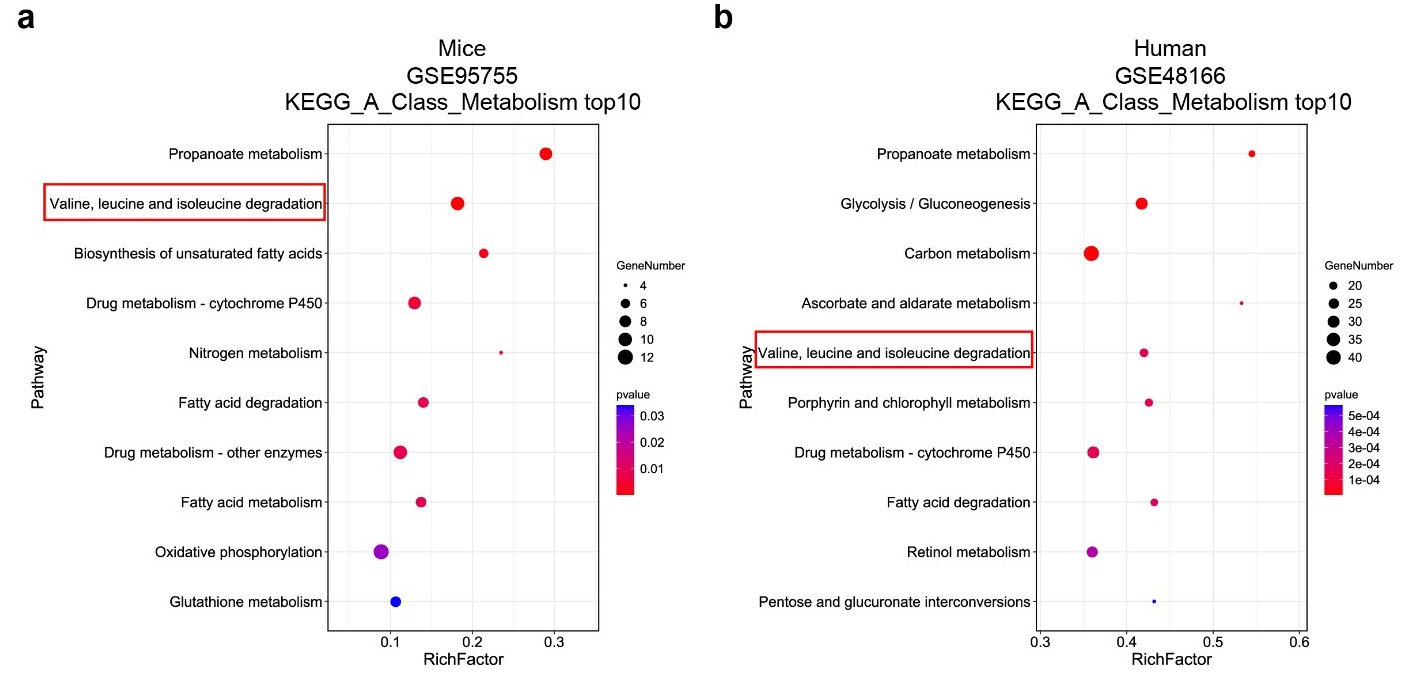
Figure. S1. BCAA catabolic defects were seen in the post-ischemic heart. (a) KEGG analysis of DEGs downregulated in the hearts of mice with ICM compared to healthy controls. (b) KEGG analysis of DEGs downregulated in hearts of humans with ICM compared to healthy donors.
引用方式:
Kyoto Encyclopedia of Genes and Genomes (KEGG) enrichment analysis was performed using the OmicShare tool (https://www.omicshare.com/tools/home/report/koenrich.html).
参考文献:
Zhang F, Hu G, Chen X, et al. Excessive branched-chain amino acid accumulation restricts mesenchymal stem cell-based therapy efficacy in myocardial infarction[J]. Signal Transduction and Targeted Therapy, 2022, 7(1): 171-171.
案例2:
发表期刊:Environmental Science & Technology
影响因子:11.4
发表时间:2023
引用方式:The OmicShare tool was used to analyze the KEGG enrichment pathways of the DEGs.
参考文献:
Lai J, Li Z, Wang Y, et al. Tritium and Carbon-14 Contamination Reshaping the Microbial Community Structure, Metabolic Network, and Element Cycle in the Seawater Environment[J]. Environmental Science & Technology, 2023, 57(13): 5305-5316.
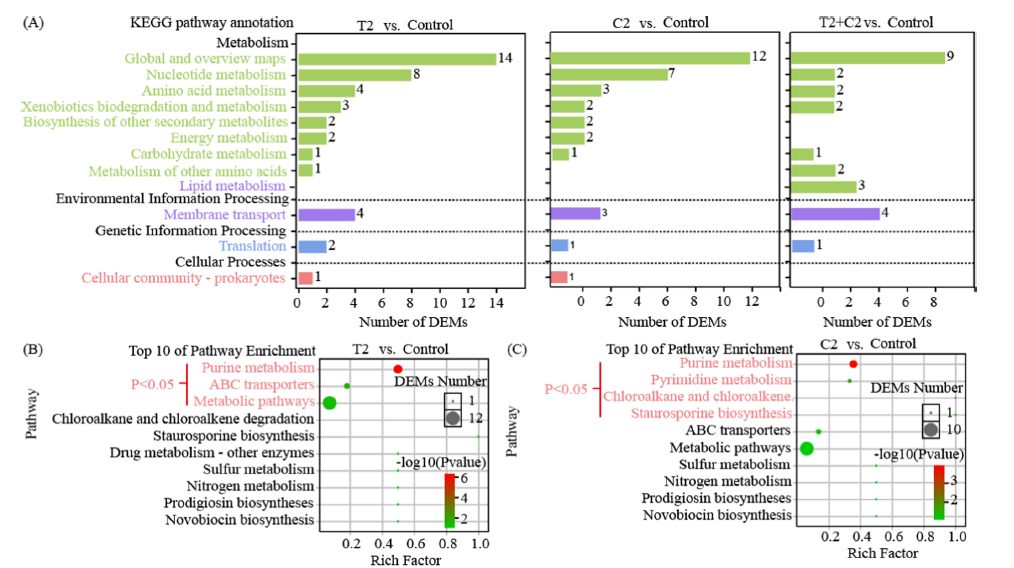
案例3:
发表期刊:Nutrients
影响因子:5.9
发表时间:2022
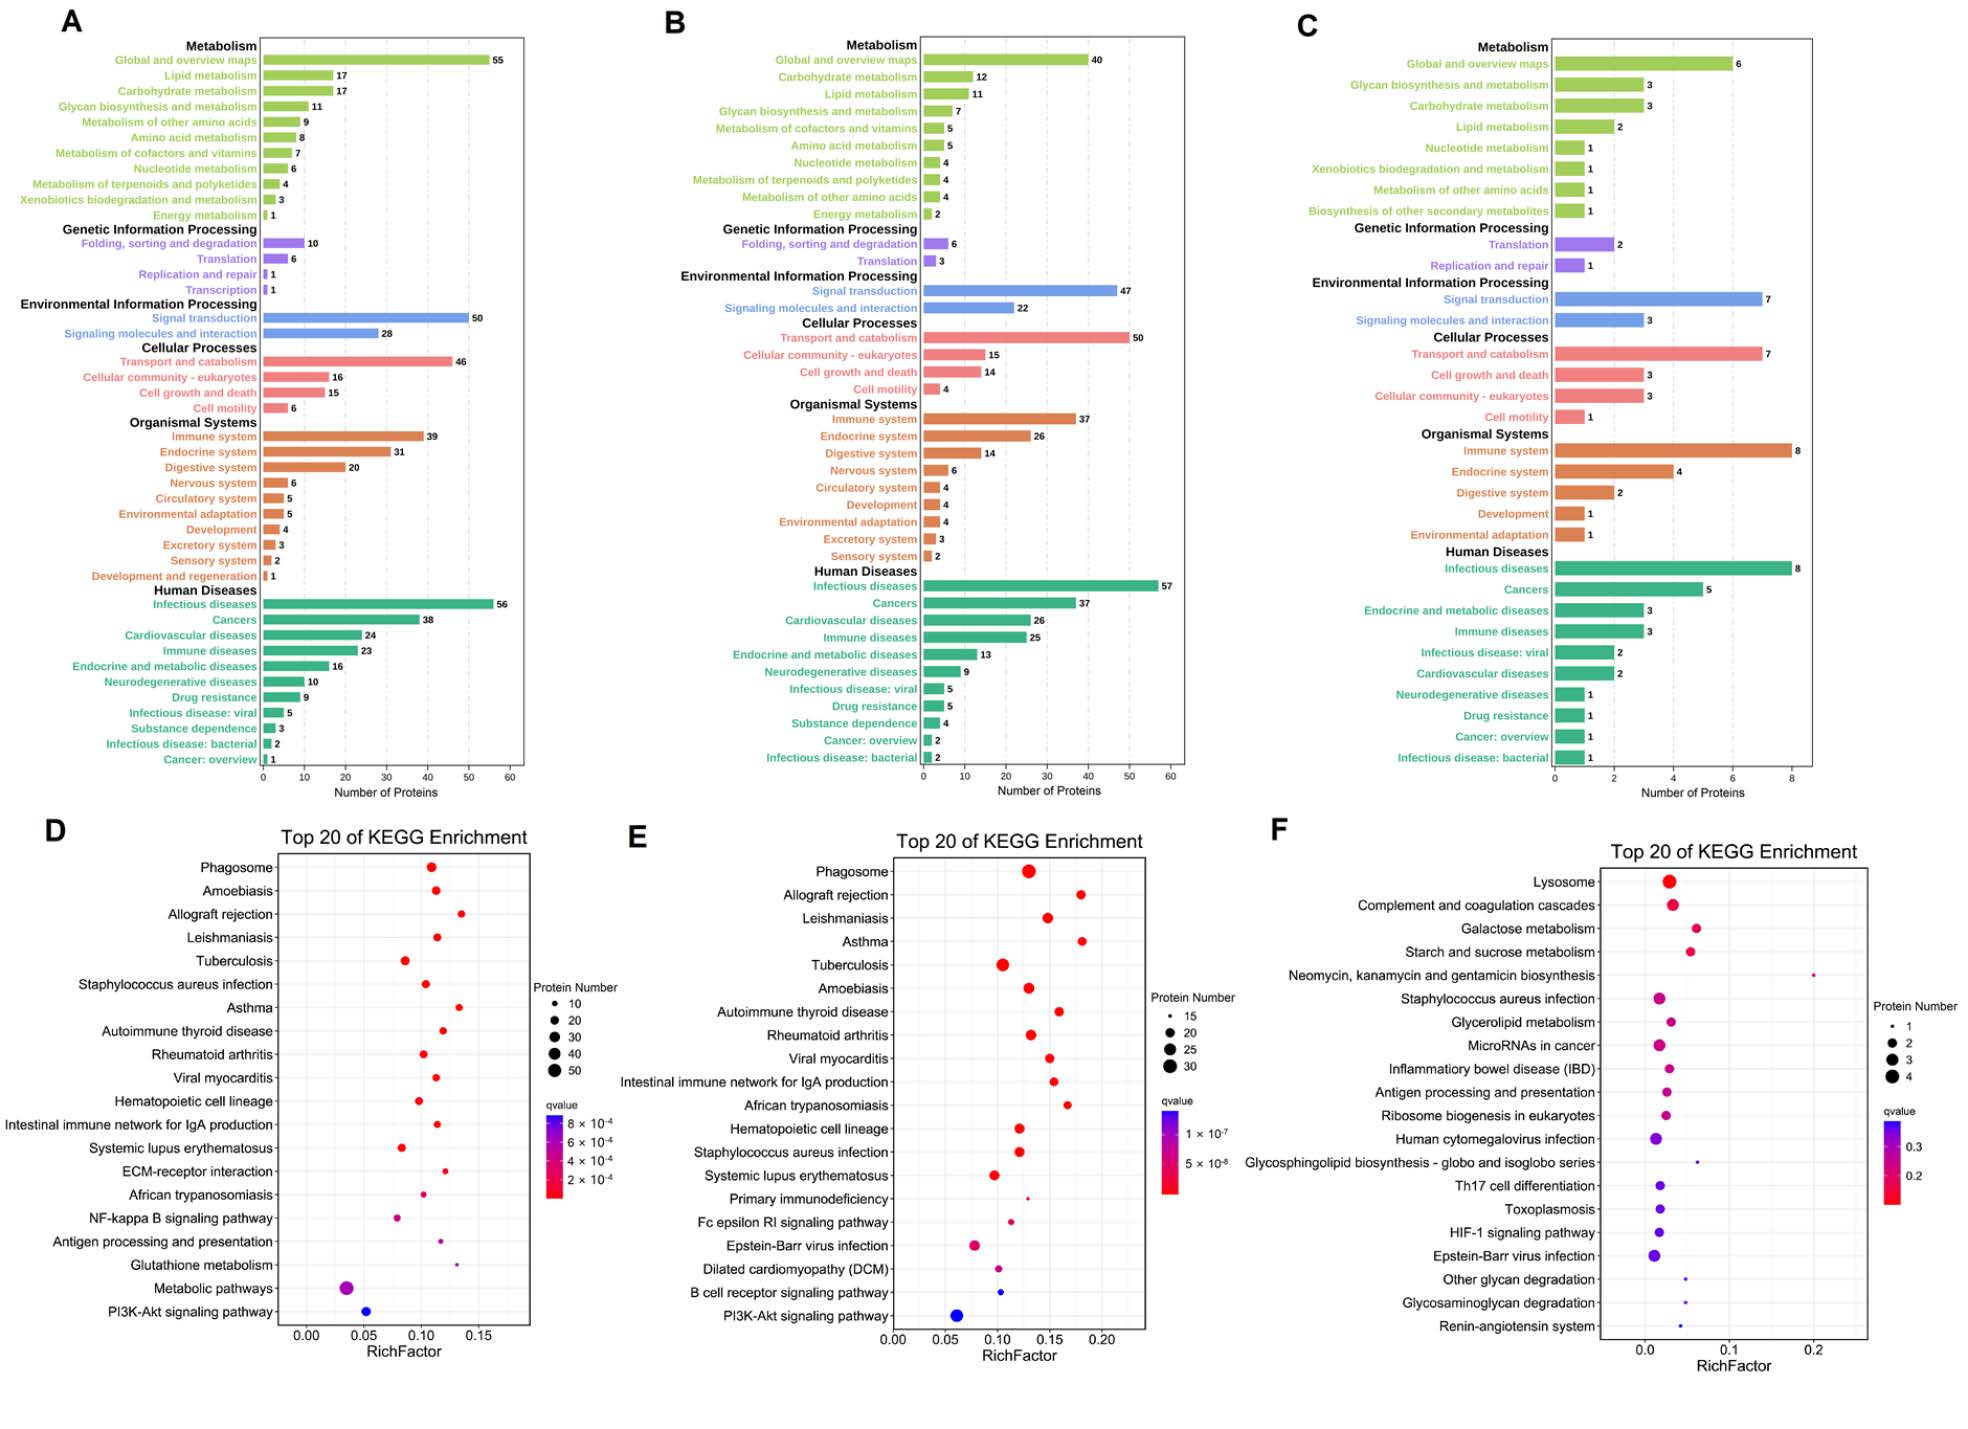
Figure 5. Analysis of differentially expressed proteins in C vs. M (A), C vs. T (B), and M vs. T (C) in KEGG pathway. Top 20 of KEGG enrichment pathway in C vs. M (D), C vs. T (E), and M vs. T (F).
引用方式:Omicshare online software was used for gene ontology (GO) annotation to analyze the annotation function of milk protein. Pathway analysis of the identified milk proteins was performed based on the online Omicshare software using the Kyoto Encyclopedia of Genes and Genomes (KEGG) pathway database.
参考文献:
Zhang Y, Zhang X, Mi L, et al. Comparative proteomic analysis of proteins in breast milk during different lactation periods[J]. Nutrients, 2022, 14(17): 3648.
案例4:
发表期刊:Frontiers in cell and developmental biology
影响因子:5.5
发表时间:2021
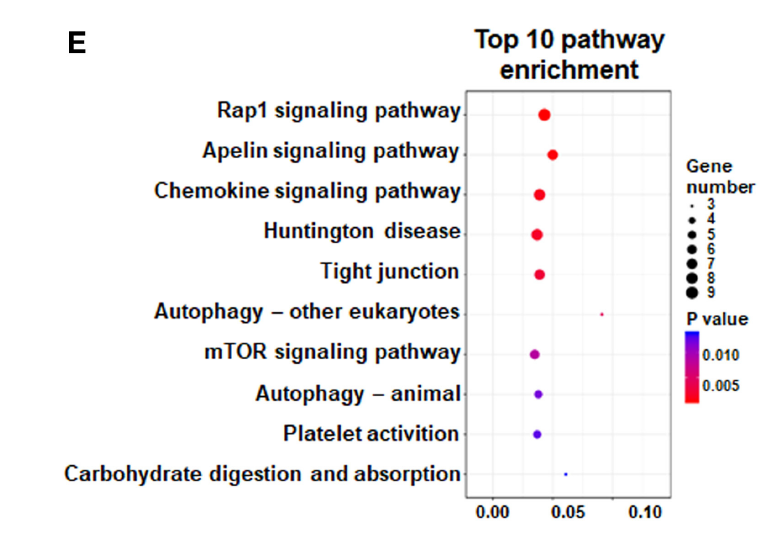
FIGURE 2. (E) KEGG analysis was performed to identify differential pathway enrichment.
引用方式:Data analysis was performed using the OmicShare tools at www.omicshare.com/tools.
参考文献:
Gao X Y, Zang J, Zheng M H, et al. Temozolomide treatment induces HMGB1 to promote the formation of glioma stem cells via the TLR2/NEAT1/Wnt pathway in glioblastoma[J]. Frontiers in cell and developmental biology, 2021, 9: 620883.
案例5:
发表期刊:Journal of Ethnopharmacology
影响因子:5.4
发表时间:2023

Fig. 7. GO and KEGG enrichment analysis. A Enrichment results of biological processes. B Enrichment results of KEGG pathways. C Multiple common targets were enriched in the TNF signaling pathway.
引用方式:The OmicShare website (https://www.omicshare.com/) was used to draw the dynamic enrichment bubble plot of GO analysis and signaling pathways.
参考文献:
Yan M, Zhao J, Kang Y, et al. Effect and mechanism of safranal on ISO-induced myocardial injury based on network pharmacology[J]. Journal of Ethnopharmacology, 2023, 305: 116103.
案例6:
发表期刊:International Journal of Molecular Sciences
影响因子:5.6
发表时间:2022

Figure 4. Gene co-expression network analysis. (c) KO (KEGG Ontology) enrichment circle diagram of cyan module (from the outside to the inside, the first circle represents the top 20 enrichment pathways, and the number outside the circle is the coordinate ruler of the number of genes; The second circle represents the number and Q value of background genes in this pathway, and the more genes, the longer the bar; The third circle represents the number of the DEGs in this pathway; The fourth circle represents the value of Rich Factor in each pathway)
引用方式:By means of the OmicShare tools (https://www.omicsmart.com/, accessed on 1 November 2021), a weighted gene co-expression network analysis was constructed to explore molecular regulatory mechanisms involved in photosynthesis.
参考文献:
Zhang L, Zhang Z, Fang S, et al. Metabolome and transcriptome analyses unravel the molecular regulatory mechanisms involved in photosynthesis of Cyclocarya paliurus under salt stress[J]. International Journal of Molecular Sciences, 2022, 23(3): 1161.
案例7:
发表期刊:Pharmacological Research
影响因子:9.3
发表时间:2023
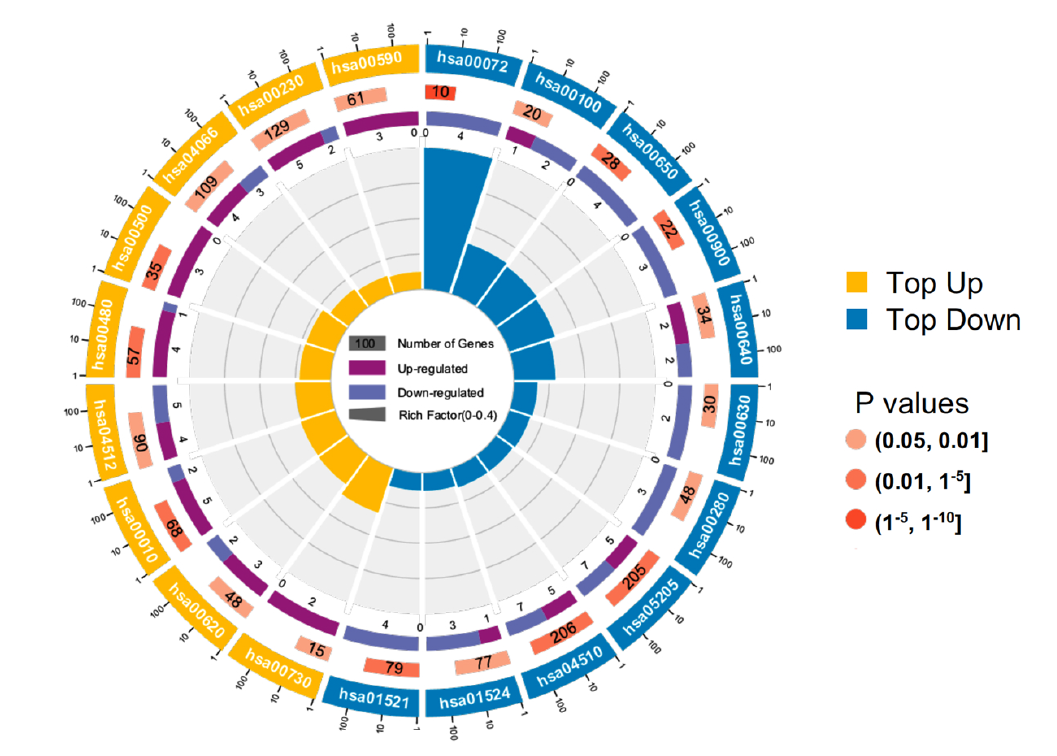
Fig. 4. Quantitative proteomics analysis of PC tumor tissues revealed the changed metabolic enzymes of AMP. (A) The KEGG pathway enrichment analysis based on differential proteins of PC tumor tissues.
引用方式:KEGG enrichment pathways with P-value less than 0.05 and relevant to this study were characterized using the OmicShare tools (https://www.omicshare.com/tools).
参考文献:
Liu J, Jing W, Wang T, et al. Functional metabolomics revealed the dual-activation of cAMP-AMP axis is a novel therapeutic target of pancreatic cancer[J]. Pharmacological Research, 2023, 187: 106554.
案例8:
发表期刊:Precision Medicine Research
发表时间:2022
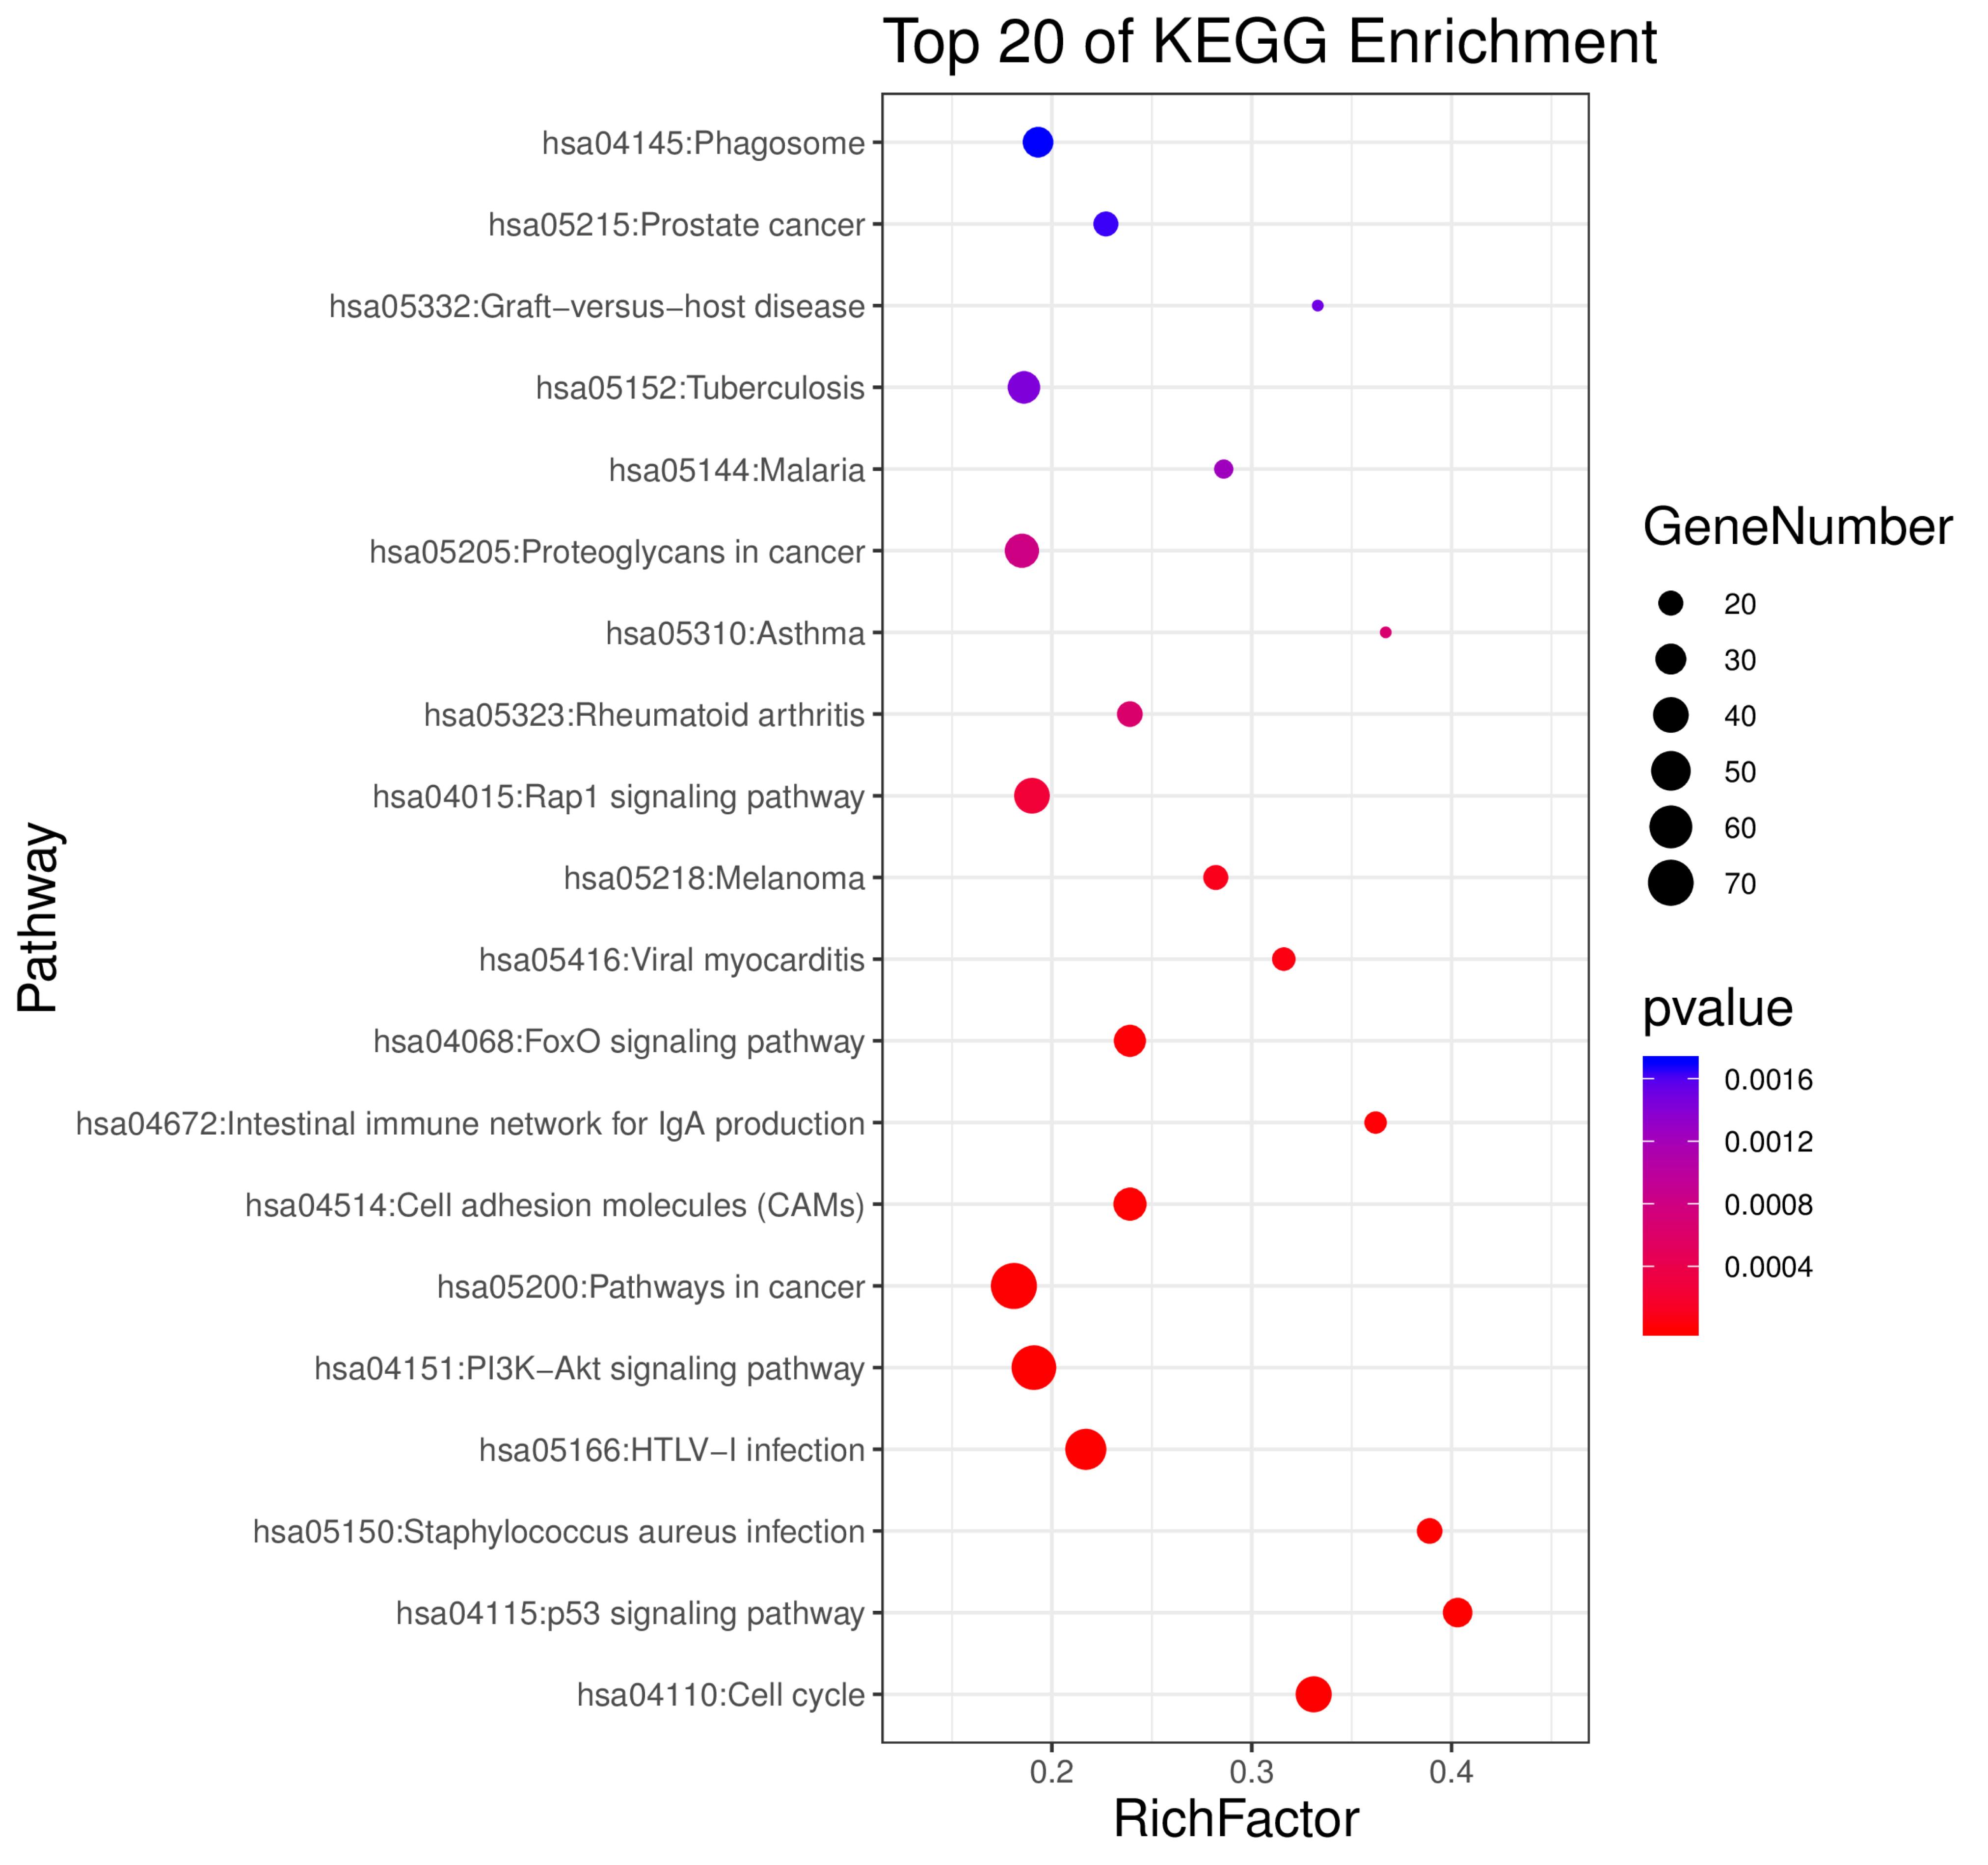
Figure 5. KEGG analysis of the overlapping DEGs between HCC and BC.
引用方式:The OmicShare database (https://www.omicshare.com/) was used for the visual analysis of KEGG and GO for enrichment analysis. Consequently, we selected the KEGG pathway analysis through the OmicShare database to execute functional annotation on HCC and BC overlapping DEGs.
参考文献:
Xie Z F, Li G G. Identification of overlapping differentially expressed genes in hepatocellular carcinoma, breast cancer, and depression by bioinformatics analysis[J]. Precis Med Res, 2022, 4(3): 11.
案例9:
发表期刊:Animals
影响因子:3.0
发表时间:2022
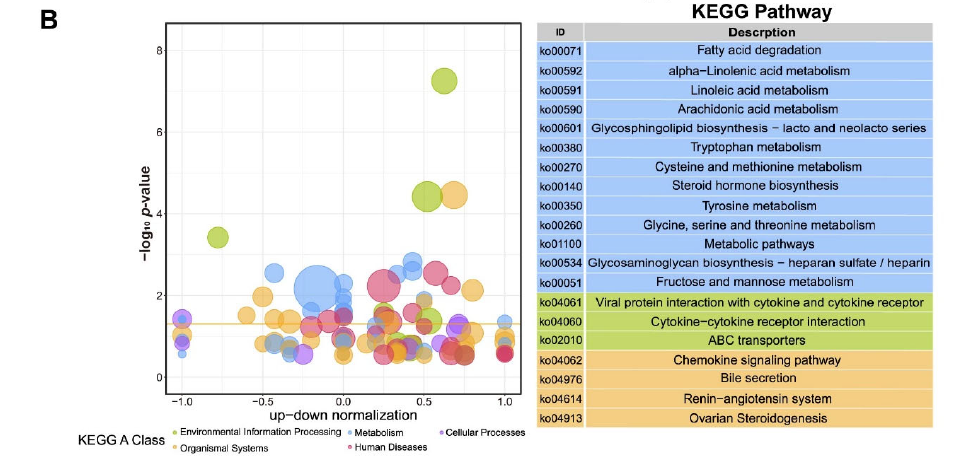
Figure 3. GO and KEGG analysis of DEGs for Duroc and Luchuan adipose. (B) KEGG summary graph showing the summary of the KEGG pathway. Different colors represent different KEGG A class categories.
引用方式:
Gene expression level was measured by Fragments per Kilobase per Million Mapped Fragments (FPKM) [17], the most commonly used method for estimating gene expression abundance. DEGSeq [18] was used to analyze DEGs (|Fold Change| > 2 and p-value < 0.01).The Principal Component Analysis (PCA), Gene Ontology (GO) term enrichment analysis, Kyoto Encyclopedia of Genes and Genomes (KEGG) pathway enrichment analysis and GSEA were performed using Omicshare, a real-time interactive online data analysis platform (p-value < 0.05) (http://www.omicshare.com (accessed on 18 February 2022)) [19].
参考文献:
Pan H, Huang T, Yu L, et al. Transcriptome Analysis of the Adipose Tissue of Luchuan and Duroc Pigs[J]. Animals, 2022, 12(17): 2258.
 (
(