


 扫码支付更轻松

1.功能:
趋势分析(Series Test of Cluster)是针对多个连续型样本的特点(样本间包含特定的时间、空间或处理剂量大小顺序)而对基因的表达模式进行聚类的方法,通过趋势分析可以找到具有相同表达模式的基因以及蛋白或代谢物等。
(Mfuzz方法)

(Stem方法)
2.应用范围:
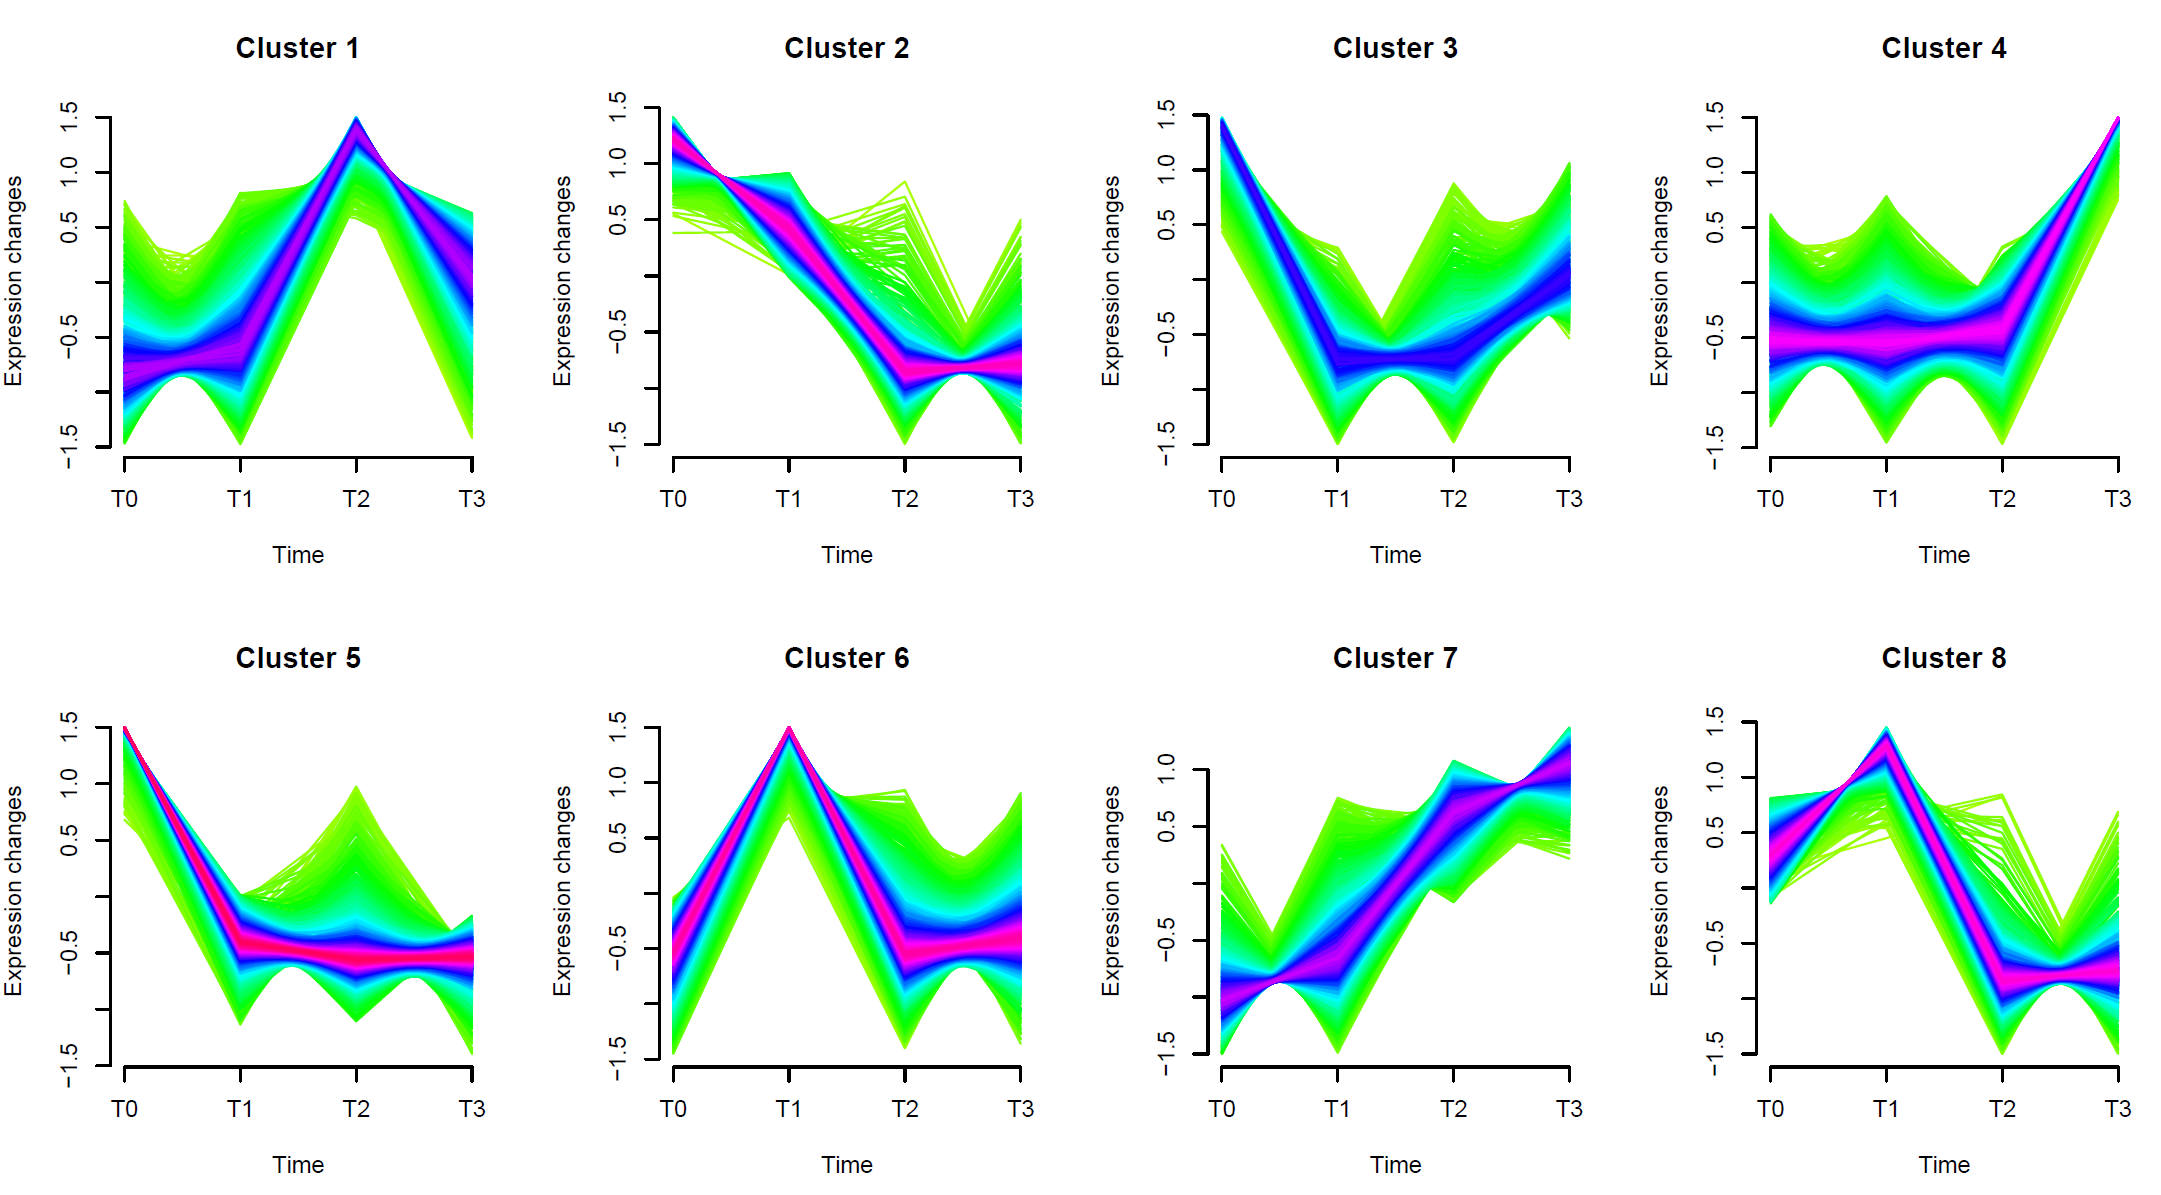
寻找及可视化基因在连续变化的样本或组中丰度的变化趋势,也可以用于蛋白质、代谢物等具有丰度变化的分析。Mfuzz主要基于模糊聚类(Soft clustering)算法的进行趋势分析,聚类效果如下图E,与之前的STEM方法(一般3~5个时间点)相比,Mfuzz方法可支持更多时间点(分组)的数据。
输入
文件格式:支持txt(制表符分隔)文本文件、csv(逗号分隔)文本文件、以及Excel专用的xlsx格式,同样支持旧版Excel的xls(Excel 97-2003 )格式。
文件内容:
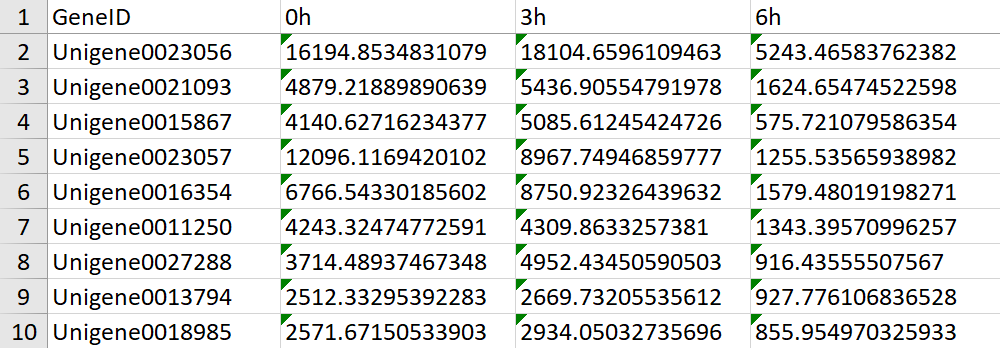
1.源表格文件:即基因表达量表。表头为样本名称,第一列为基因ID,后面为样品表达量。趋势顺序按样品在表格中的顺序排列。
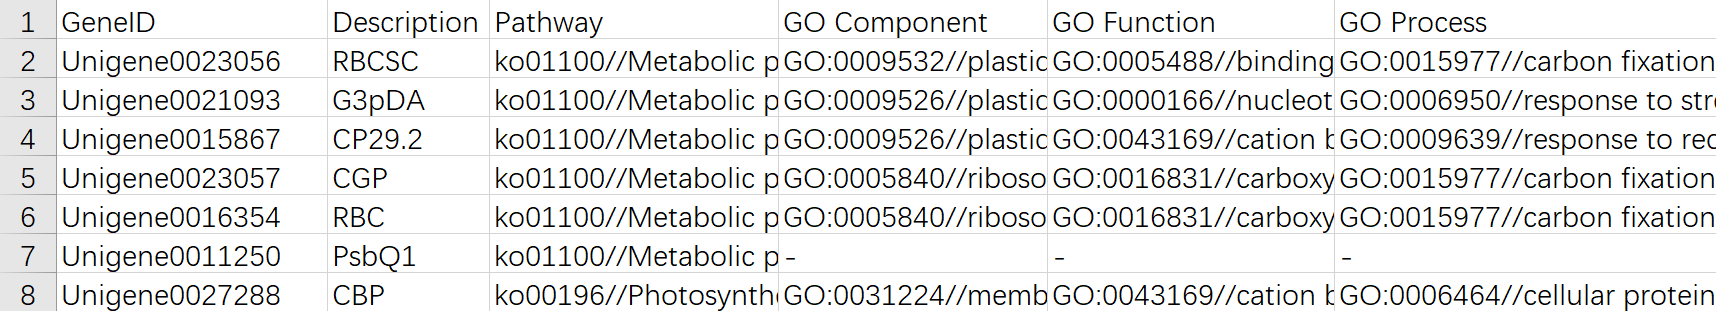
2.添加描述信息(可选):基因注释信息文件的第一列为基因名,其他列为相应基因的注释信息。
参数
趋势的数量:当两个时间点间变化的趋势数量取1的时候,趋势总个数为:3^(n-1)-1,n表示样品个数,即3个样品理论上有8个趋势。当样本个数较多时,建议控制趋势的输出个数,如5个样本数理论上应该有80个趋势,可以选择只输出20个趋势(趋势的数量建议设定为20个,最多不超过50。因为趋势预设过多会导致趋势过于零碎,后期难以整理)。
数据预处理:
① Log2标准化:推荐选择。以第一个时间点为对照,计算所有样本相对第一个时间点的表达量倍数,并对表达量倍数取log2(FC),如log2(v1/v1),log2(v2/v1),log2(v3/v1)。这样处理后,第一个样本的表达量为0,后续大于0的样本就是表达上调的样本,小于0的样本就是表达下调的样本。
② 标准化:直接用数据做趋势分析,即以第一个时间点为对照,计算所有样本相对第一个时间点的表达量的差值,即(v1-v1,v2-v1,v3-v1)。这样处理后,第一个时间点的样本表达量依然为0,但后续的时间点样本的数值会波动很大。
③ 不做标准化/加0:直接使用输入软件的原始值进行趋势分析。
③的使用条件:
a.希望直接观察表达量绝对值的变化,而不希望使用变化倍数或差值。
b.输入软件的是两组平行实验的log2 差异倍数值(A1/B1,A2/B2,A3/B3)
显著趋势的P值:默认将P值<0.05的趋势认为是显著趋势。
基因筛选的最小变化倍数:一个基因表达量的最大值和最小值的差异倍数如果小于基因筛选的最小变化倍数,则被判定为没有变化而被过滤。数值默认为2。
添加描述信息:可选择是否添加描述信息。若选择添加,则相应基因的注释信息会被自动添加到趋势分析结果的表格中。
输出
① all.xls 所有差异基因RPKM统计表(包含注释)
② All-Profile.xls 所有差异基因对应的趋势基因集统计表(包含注释)
③ trend_all_by_gene_number.png/svg 按基因数目展示所有趋势
④ trend_all_by_pvalue.png/svg 按趋势-P值展示所有趋势
⑤ Profile*.png/pdf/xls:单个趋势的展示图及相应趋势统计表
⑥ profile_stat.png/svg/xls:基因在不同趋势的数量统计图/表(显示Pvalue)
⑦ Trend_profile_line.png/pdf:所有趋势的展示图总览
一.数据准备:
文件格式及数据内容详见说明部分。
二:文件输入:
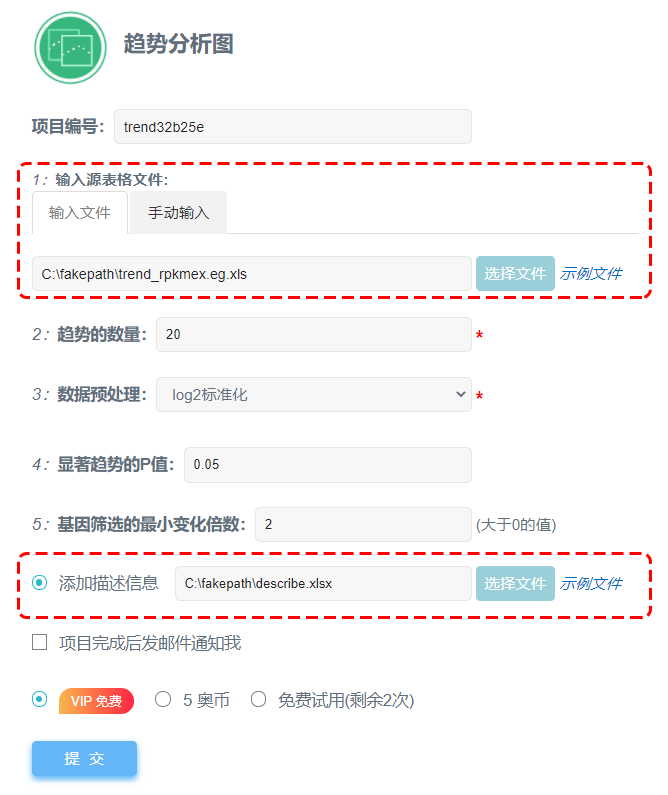
以示例文件为例,点击“选择文件”处上传源表格文件和描述信息文件(可选),源表格文件也可选择“手动输入”的方式,注意格式。
三.参数选择:
趋势的数量:默认20,若样本量较多建议趋势数量不超多50。
数据预处理:根据具体需要进行选择,一般默认选择log2标准化。
显著趋势的P值:可自定义,默认将P值<0.05 的趋势认为是显著趋势。
基因筛选的最小变化倍数:可自定义,默认为2倍。
四.结果输出:
在“我的项目中”查看进程及结果,点击“预览”可在线查看趋势分析图,点击“下载”可输出趋势分析图相关文件到本地。

1. all.xls
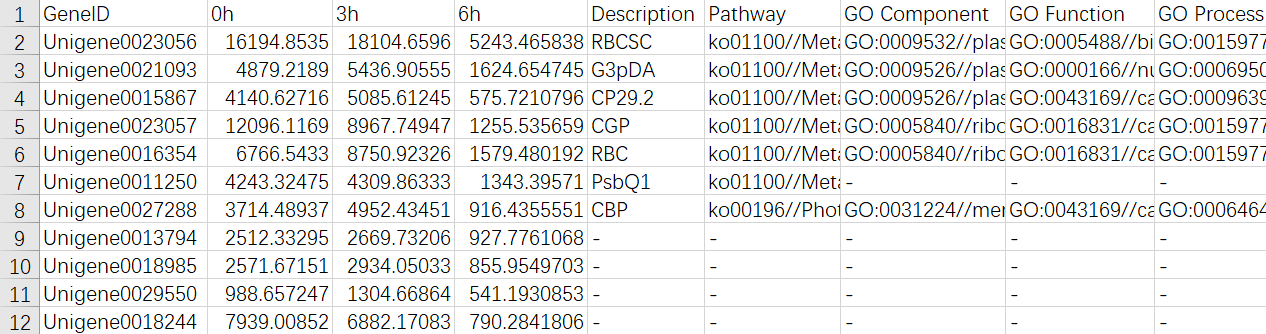
所有差异基因RPKM统计表
包含所有趋势中基因的表达量以及添加的注释信息。
2.All-Profile.xls
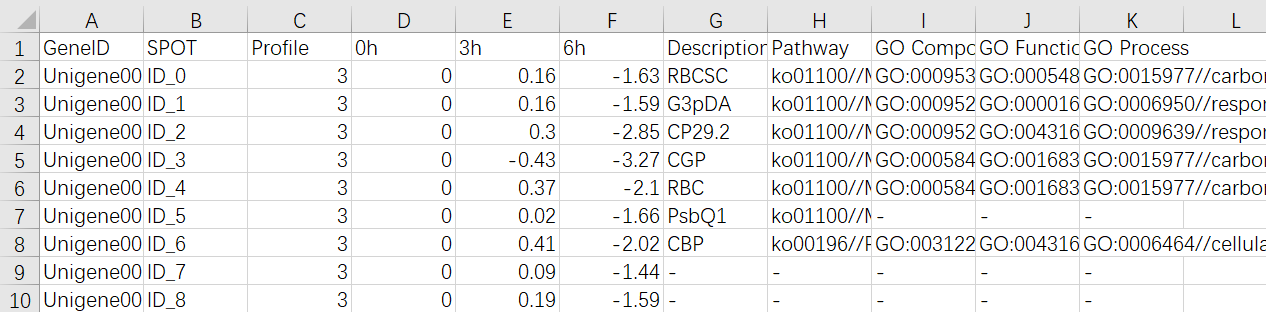
所有差异基因对应的趋势基因集统计表
第1列为gene ID;第2列为点的序号(无特定意义);第3列为基因所在的趋势ID(如示例文件,基因属profile 3 ,则这里的趋势ID就是3)。第4列到最后列分别为基因在各个点归一化后表达量值以及所添加基因的功能注释。
3. profile_stat.png
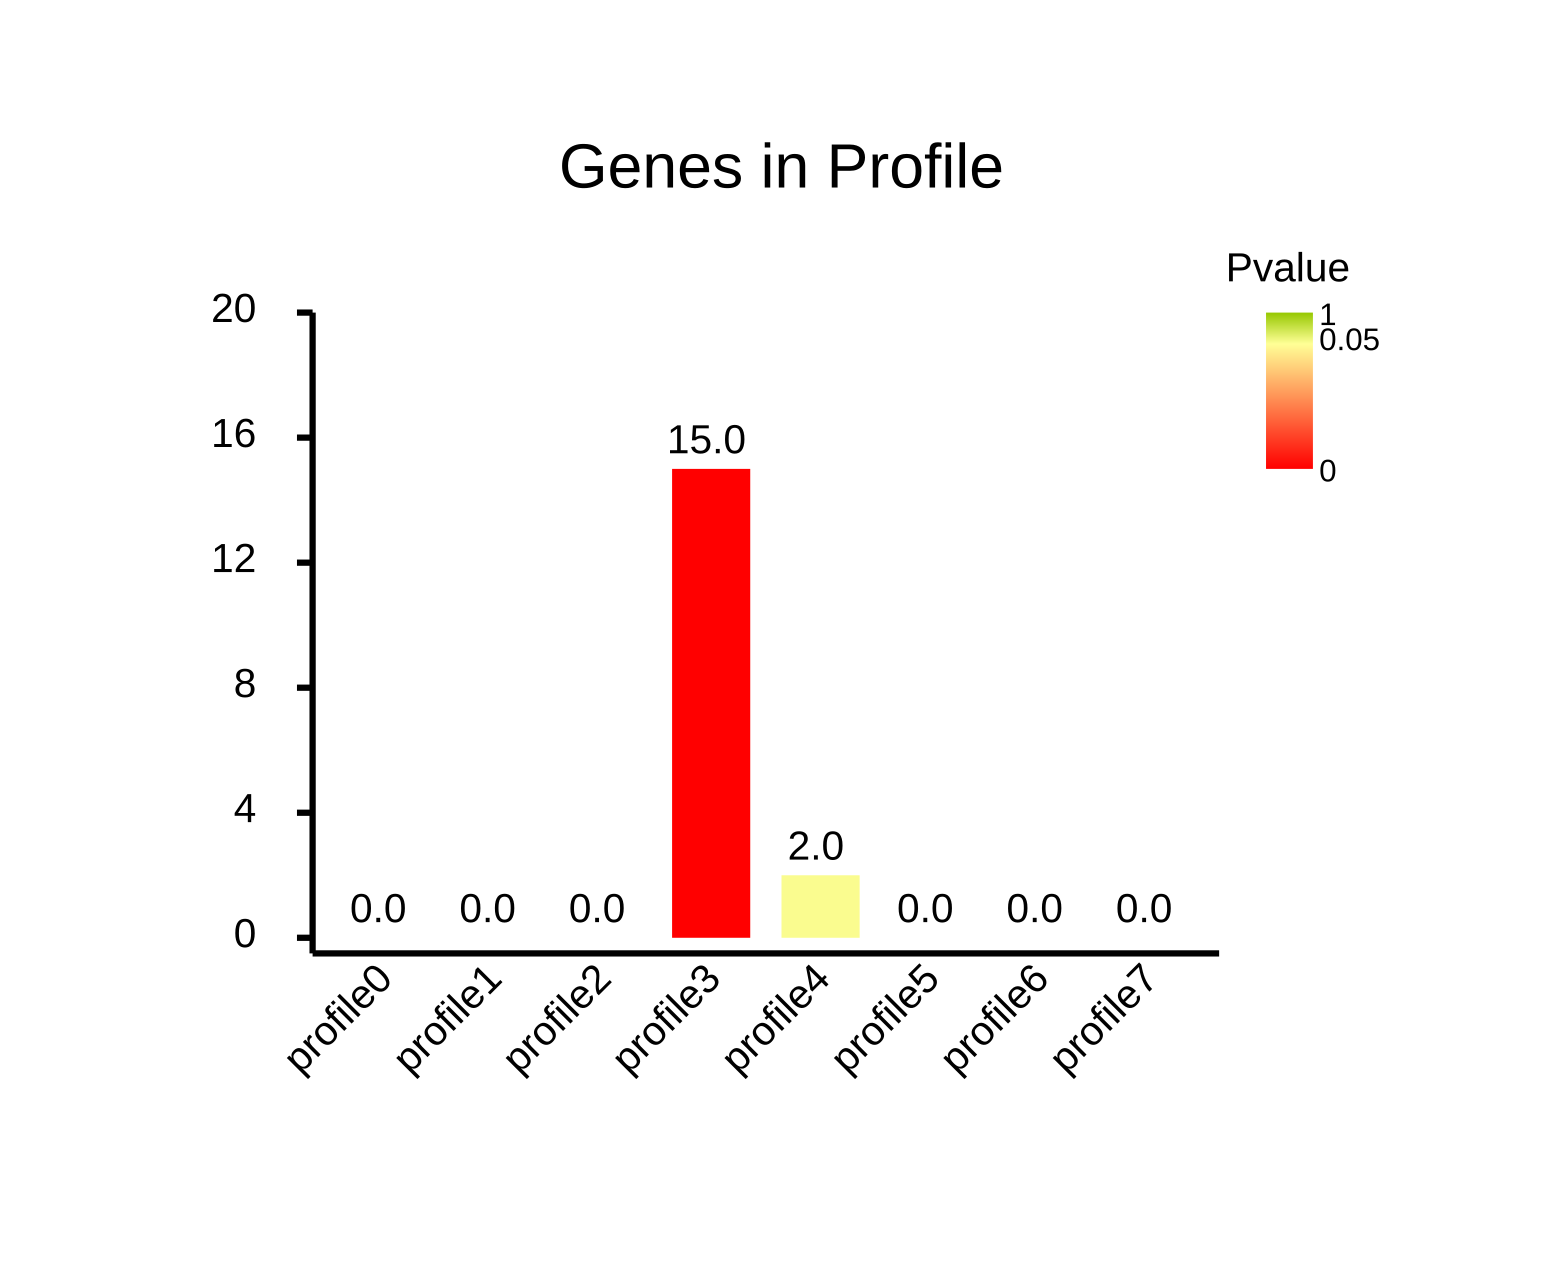
基因在不同趋势集的数量统计图
展示不同趋势内基因的数量和P值。
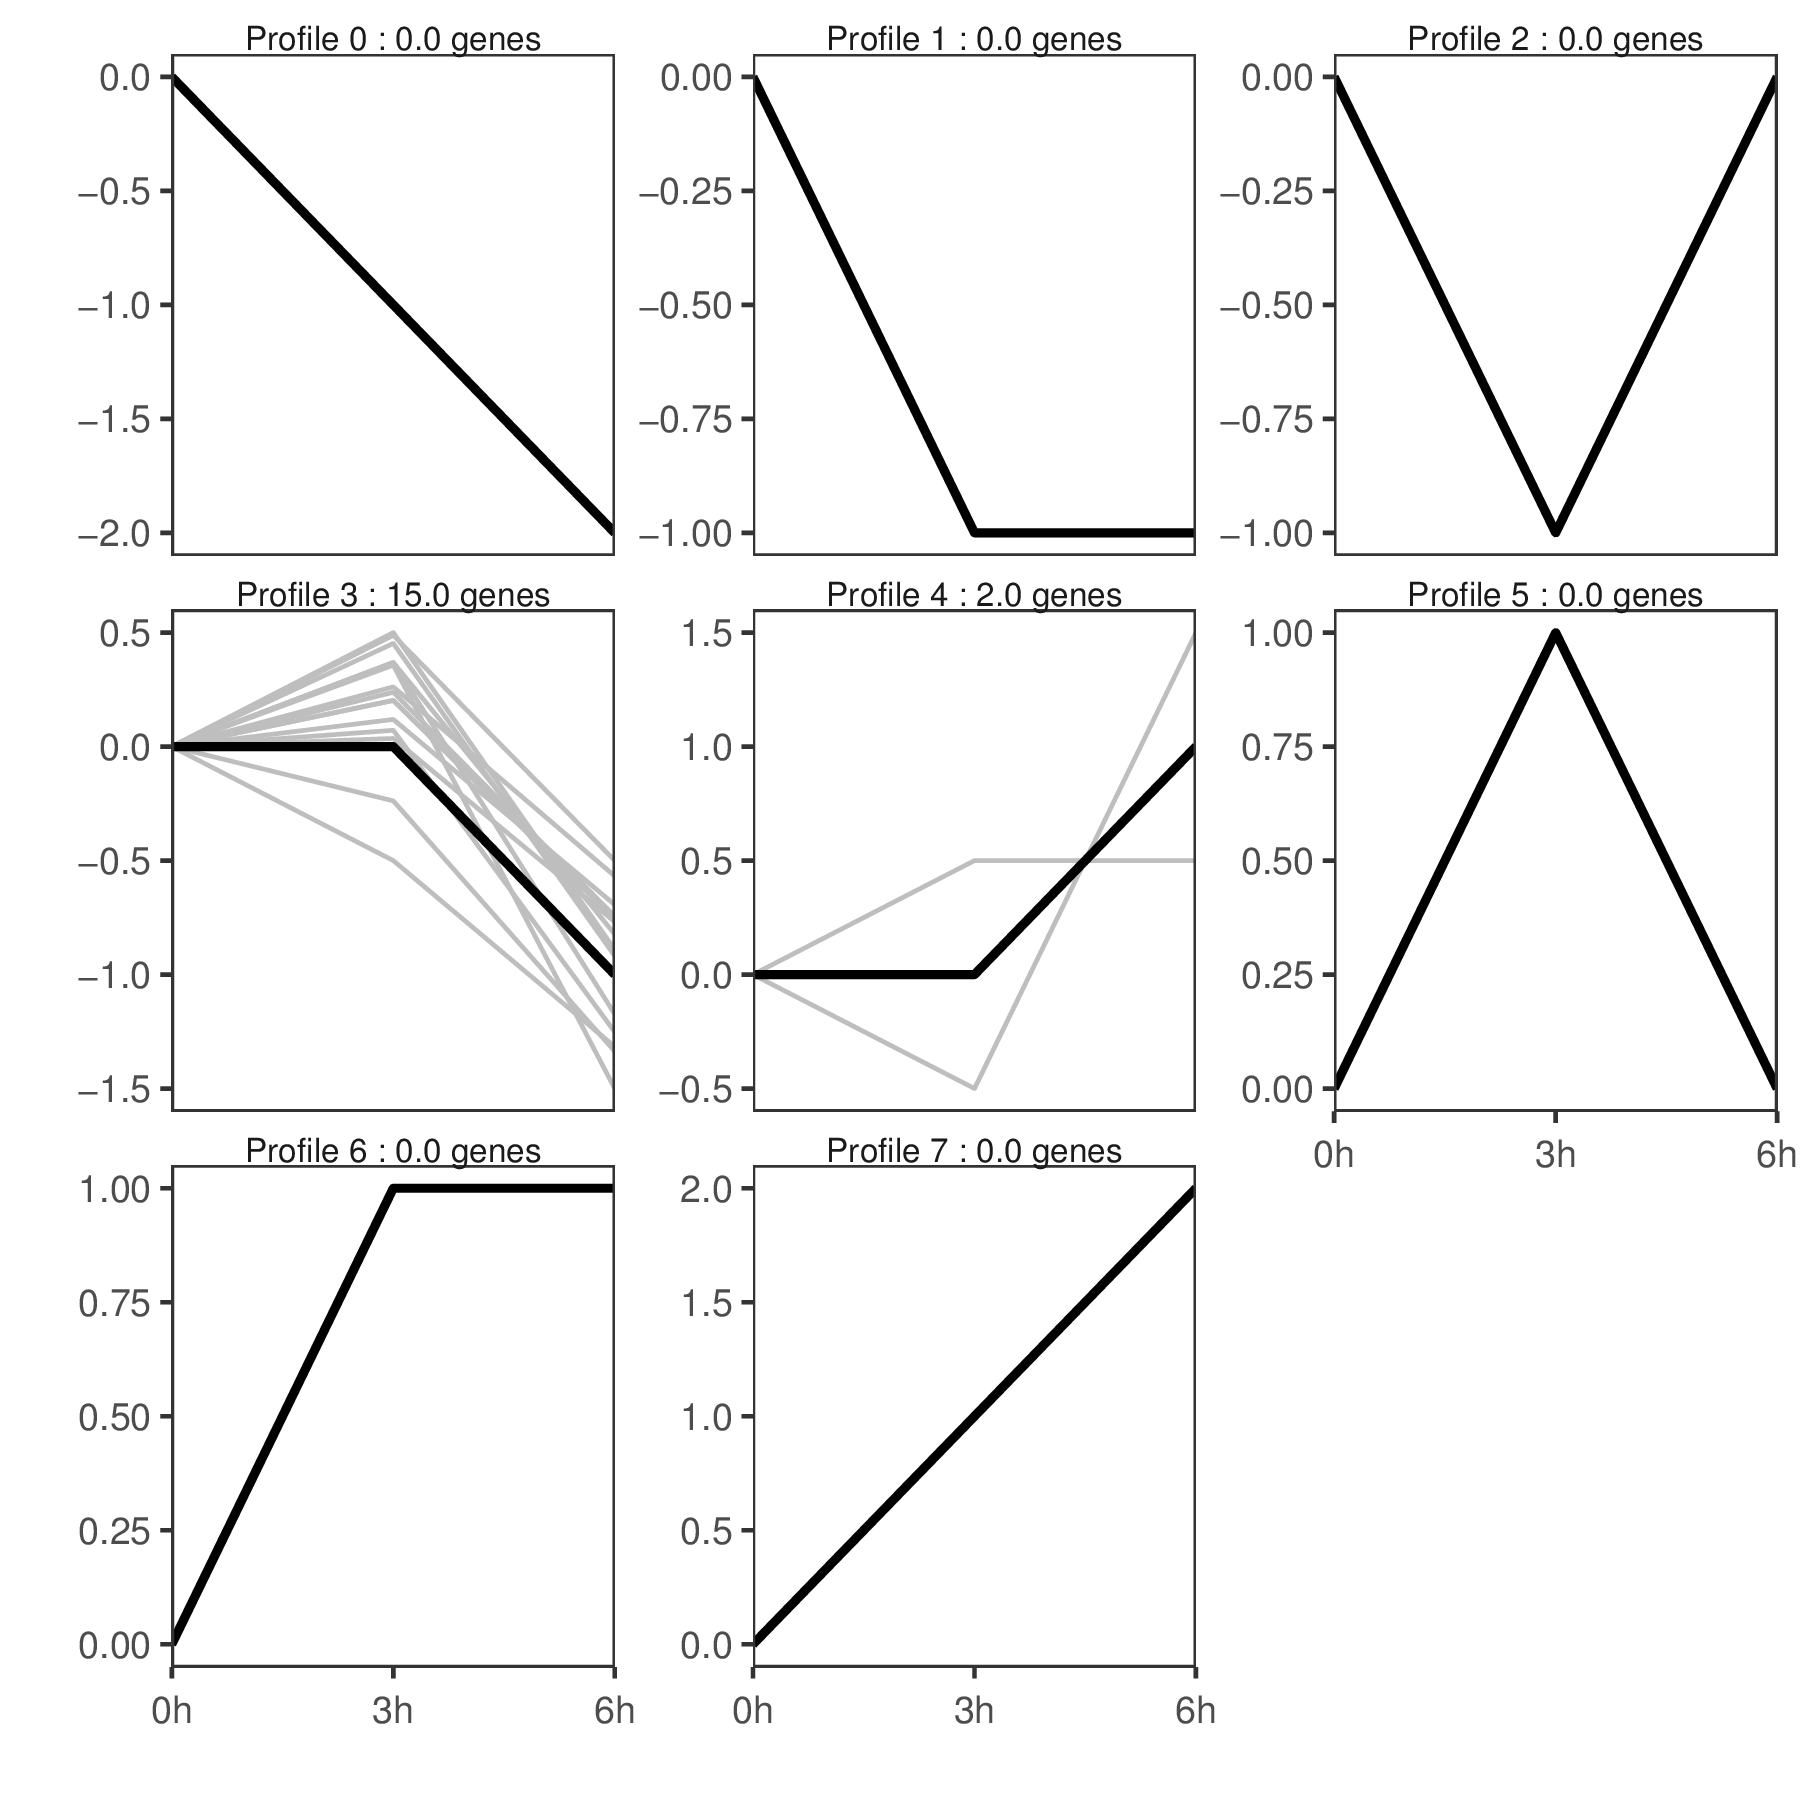
4. Profile*.png
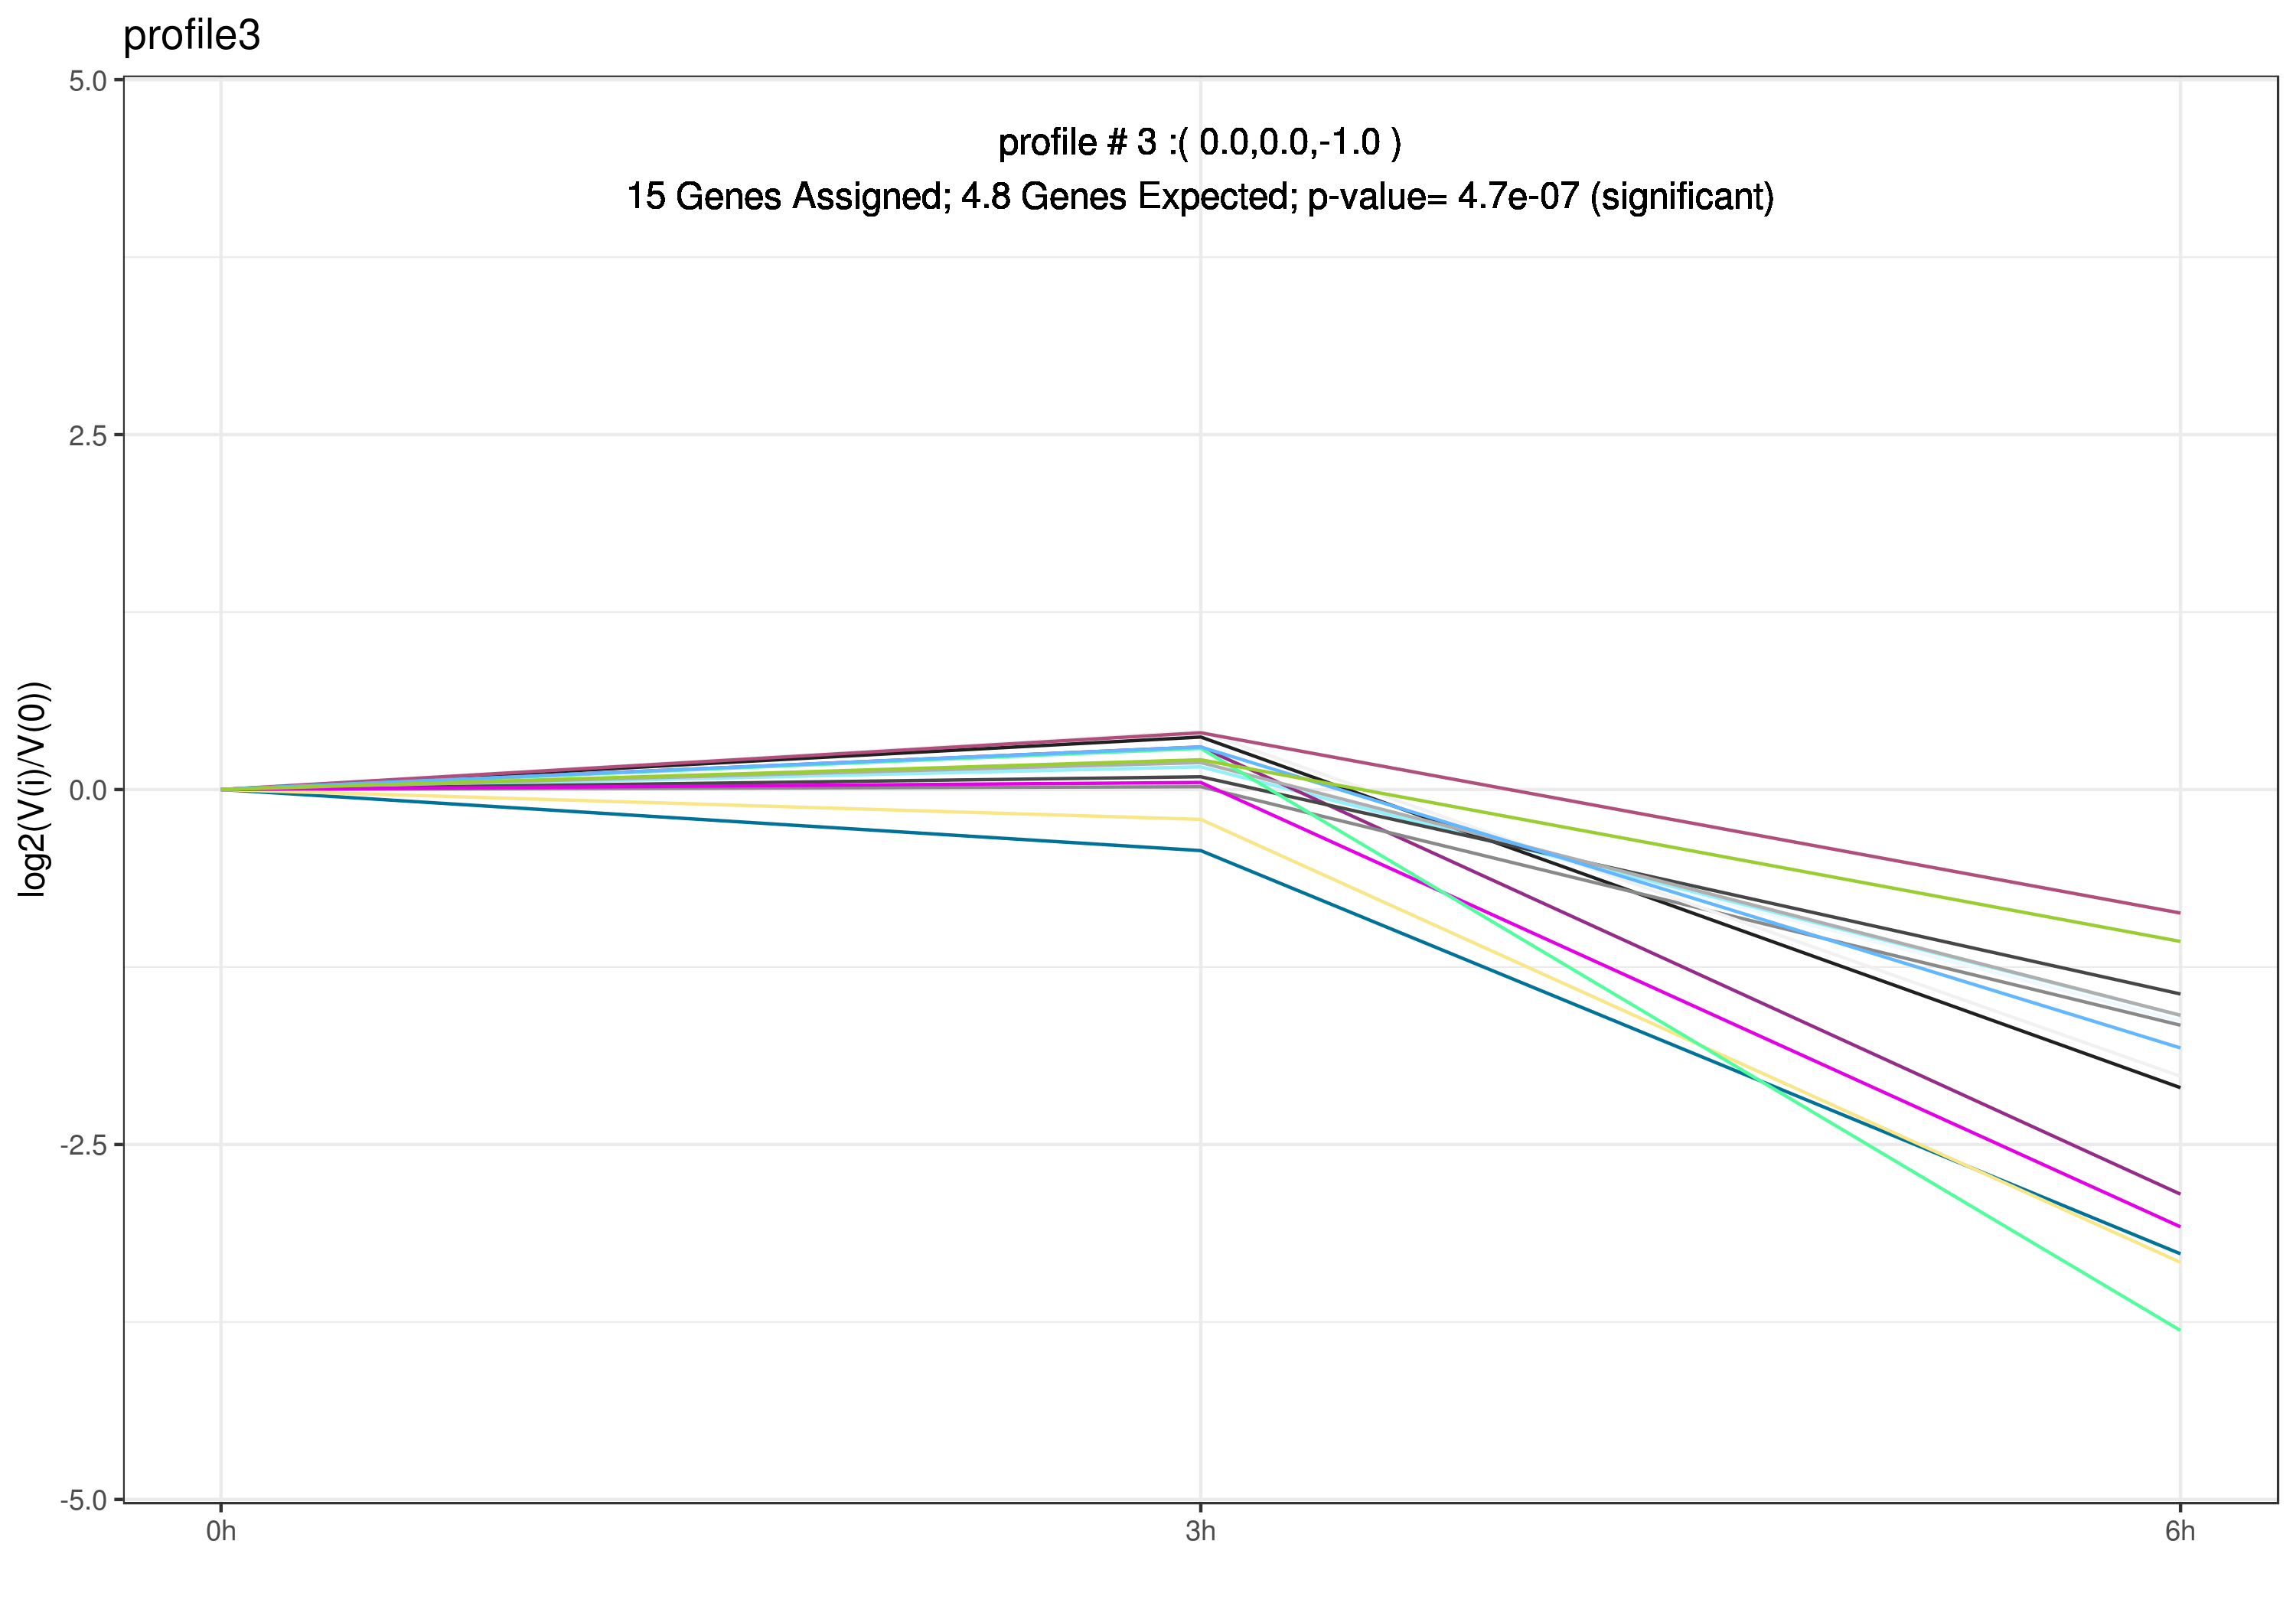 单个趋势的展示图
展示了单个趋势内所有基因的趋势情况。
5. Trend_profile_line.png
所有趋势的展示图总览
6. trend_all_by_gene_number.png/svg
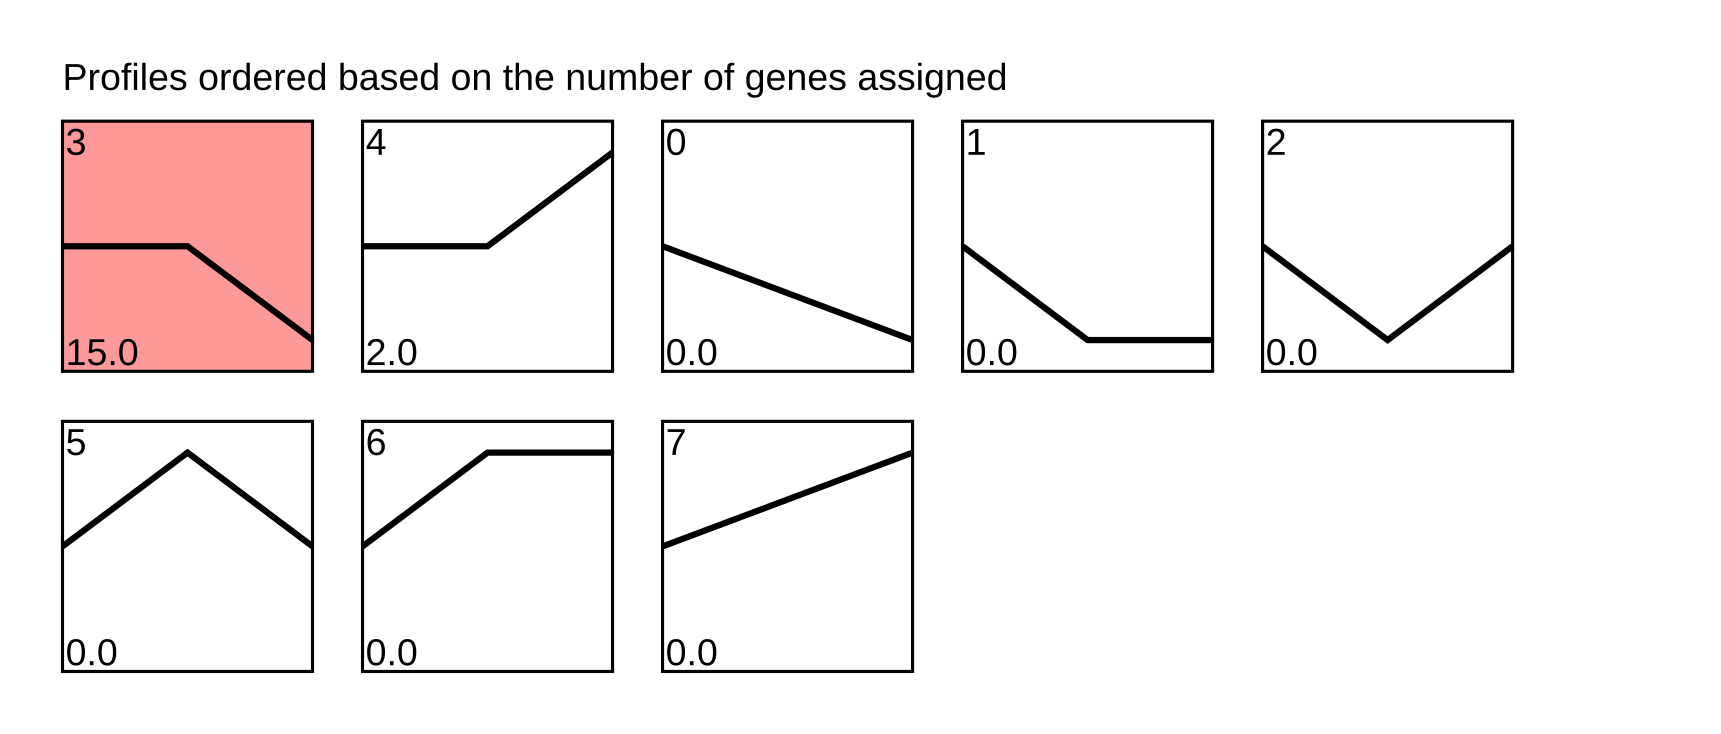
趋势分析图——按基因数目展示所有趋势
7.trend_all_by_pvalue.png/svg
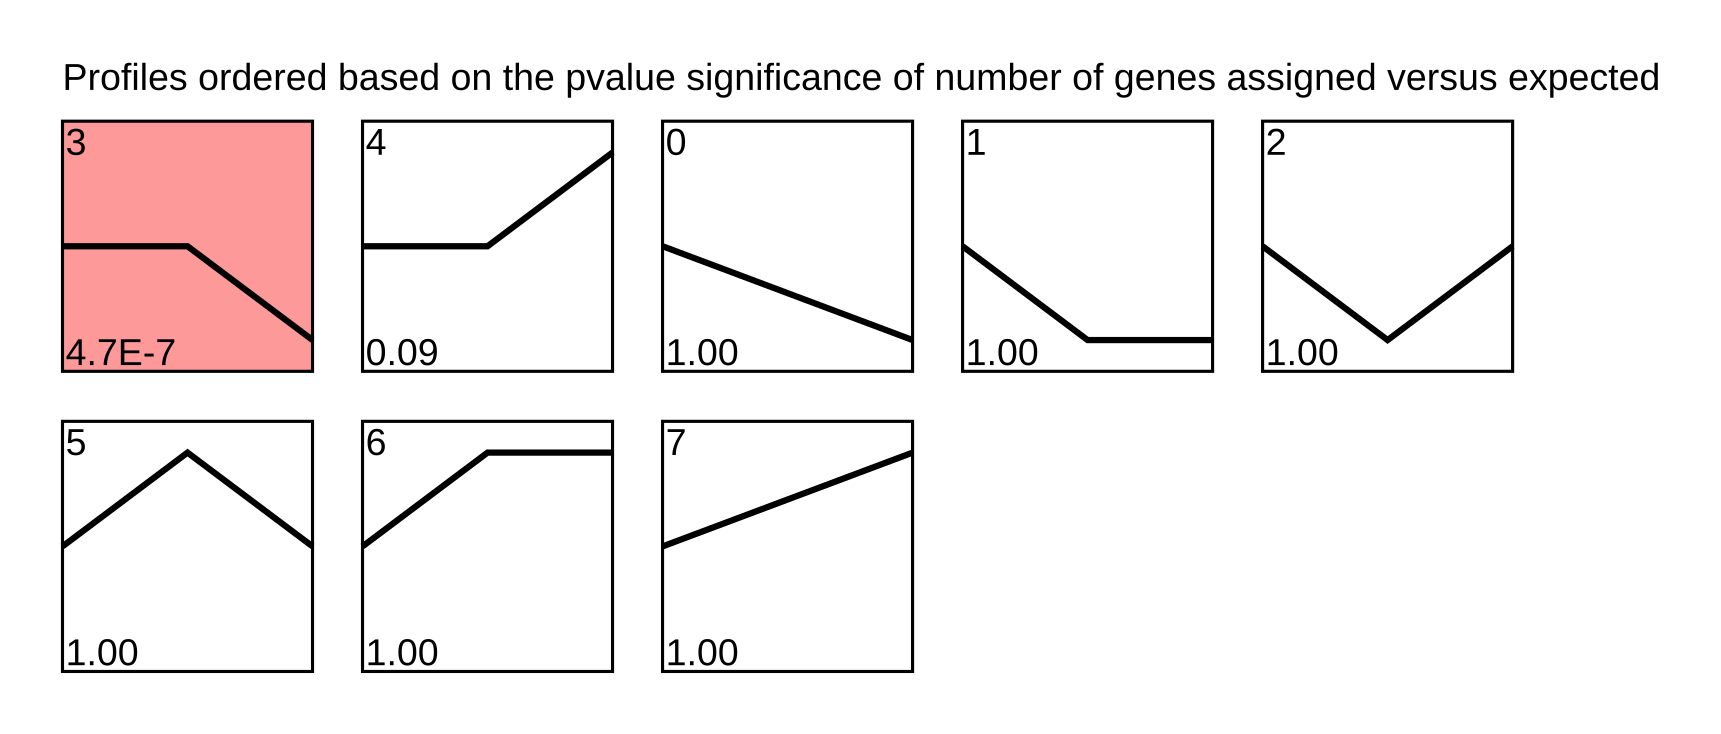
趋势分析图——按趋势的P值展示所有趋势
Q1. 提交时报错常见问题:
1.提交时显示X行X列空行/无数据,请先自查表格中是否存在空格或空行,需要删掉。
2.提交时显示列数只有1列,但表格数据不止1列:列间需要用分隔符隔开,先行检查文件是否用了分隔符。
其它提示报错,请先自行根据提示修改;如果仍然无法提交,可通过左侧导航栏的“联系客服”选项咨询OmicShare客服。
Q2. 趋势分析任务出错?
1.只输入两组样本,运行会出错。趋势分析的目的是看基因表达量变化趋势,三组及以上才能看出波动变化(如持续下调、先上调再下调等),因此必须输入三组及以上连续型样本。
2.使用代谢物等进行分析,名称可能会有大量特殊符号,导致任务出错。
建议:在表达量表中用代号符号(如a1、a2....替换掉名称),然后在“添加描述信息”中,另外上传含代号、代谢物名称的文件,名称等信息会自动填充到结果文件中。

Q3. 提交的任务完成后却不出图该怎么办?
主要原因是上传的数据文件存在特殊符号所致。可参考以下建议逐一排查出错原因:
(1)数据中含中文字符,把中文改成英文;
(2) 数据中含特殊符号,例如 %、NA、+、-、()、空格、科学计数、罗马字母等,去掉特殊符号,将空值用数字“0”替换;
(3)检查数据中是否有空列、空行、重复的行、重复的列,特别是行名(一般为gene id)、列名(一般为样本名)出现重复值,如果有删掉。
排查完之后,重新上传数据、提交任务。如果仍然不出图,可通过左侧导航栏的“联系客服”选项咨询OmicShare客服。
Q4.下载的结果文件用什么软件打开?
OmicShare云平台的结果文件(例如,下图为KEGG富集分析的结果文件)包括两种类型:图片文件和文本文件。

图片文件:
为了便于用户对图片进行后期编辑,OmicShare同时提供位图(png)和矢量图(pdf、svg)两种类型的图片。对于矢量图,最常见的是pdf和svg格式,常用Ai(Adobe illustrator)等进行编辑。其中,svg格式的图片可用网页浏览器打开,也可直接在word、ppt中使用。
文本文件:
文本文件的拓展名主要有4种类型:“.os”、“.xls”、“.log”和“.txt”。这些文件本质上都是制表符分隔的文本文件,使用记事本、Notepad++、EditPlus、Excel等文本编辑器直接打开即可。结果文件中,拓展名为“.os”文件为上传的原始数据;“.xls”文件一般为分析生成的数据表格;“.log”文件为任务运行日志文件,便于检查任务出错原因。
Q5. 提交的任务一直在排队怎么办?
提交任务后都需要排队,1分钟后,点击“任务状态刷新”按钮即可。除了可能需运行数天的注释工具,一般工具数十秒即可出结果,如果超出30分钟仍无结果,请联系OS客服,发送任务编号给OmicShare客服,会有专人为你处理任务问题。
Q6. 结果页面窗口有问题,图表加载不出来怎么办?
尝试用谷歌浏览器登录OmicShare查看结果文件,部分浏览器可能不兼容。
引用OmicShare Tools的参考文献为:
Mu, Hongyan, Jianzhou Chen, Wenjie Huang, Gui Huang, Meiying Deng, Shimiao Hong, Peng Ai, Chuan Gao, and Huangkai Zhou. 2024. “OmicShare tools: a Zero‐Code Interactive Online Platform for Biological Data Analysis and Visualization.” iMeta e228. https://doi.org/10.1002/imt2.228案例1:
发表期刊:Tree physiology
影响因子:4.0
发表时间:2021
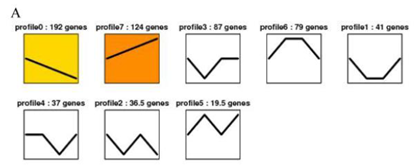
Figure 4 . Trend analysis and lncRNA mRNA regulatory networks. ( Schematic diagram of gene expression trends between samples . The trend ID and the number of genes it contains are at the top. T he colored trend blocks indicate a trend of significant enrichment, and different colors indicate different trends. The partial correlation
引用方式:The hierarchical clustering analys es of all differentially expressed lncRNAs and protein coding genes were implemented by the OmicShare tools ( www.omicshare.com/tools ).
参考文献:
Li L, Liu J, Liang Q, et al. Genome-wide analysis of long noncoding RNAs affecting floral bud dormancy in pears in response to cold stress[J]. Tree physiology, 2021, 41(5): 771-790.
案例2:
发表期刊:Frontiers in Oncology
影响因子:4.7
发表时间:2022
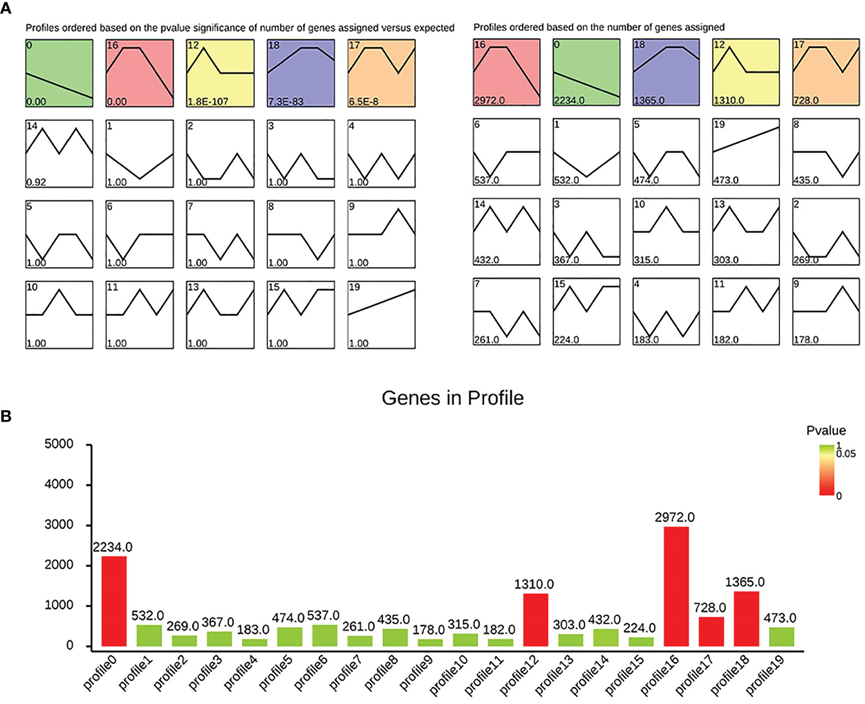
FIGURE 1 Dynamic trend analysis: (A) the significance and gene number of each module; (B) histogram showing the situation of each module.
引用方式:Trend analysis can classify genes with similar change characteristic patterns within a changing trend. We used the OmicShare online tool (https://www.omicshare.com/tools/) for analysis. P <.05 was considered statistically significant. The number of trends is chosen to be 20.
参考文献:
Gao W, Yang M. Identification by Bioinformatics Analysis of Potential Key Genes Related to the Progression and Prognosis of Gastric Cancer[J]. Frontiers in Oncology, 2022, 12: 881015.
案例3:
发表期刊:BMC Plant Biology
影响因子:5.3
发表时间:2023
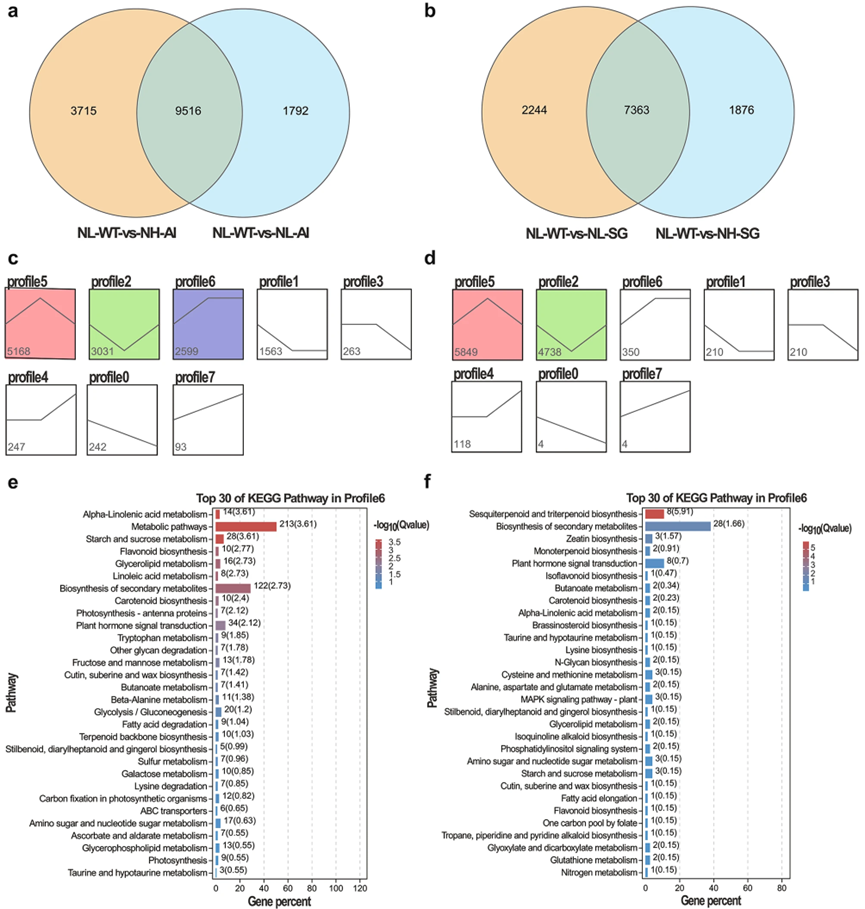
Fig 8.Trend analysis of DEGs enrichment under different nitrogen levels. (a,b) Venn diagram analysis. (c,d) Trend analysis of differentially expressed genes. The 15,023 DEGs from NL-Al, NL-WT and NH-Al were clustered into 8 profiles. The 11,483 DEGs from NL-SG, NL-WT and NH-SG were clustered into 8 profiles. (e,f) Top 30 of KEGG pathway enrichment of DEGs in Profile 6
引用方式:
Venn diagrams and heatmaps were generated using OmicShare tools, a free online platform for data analysis (https://www.omicshare.com/tools). All DEGs were mapped to GO terms in the Gene Ontology database [48]. The KEGG pathways were used to assign DEGs with the online KEGG automatic annotation server (KAAS) [49,50,51]. An FDR below 0.05 was the threshold to identify significant GO terms and enriched pathways in DEGs. Then, the KEGG network was also generated using OmicShare tools.
To further explore the regulatory network of gene expression associated with the phenotype of seedlings, gene co-expression networks of 24,882 genes of which FPKM values > 5.8 were constructed using OmicShare tools.
参考文献:
Feng Y, Li Y, Zhao Y, et al. Physiological, transcriptome and co-expression network analysis of chlorophyll-deficient mutants in flue-cured tobacco[J]. BMC Plant Biology, 2023, 23(1): 1-16.
案例4:
发表期刊:Frontiers in Plant Science
影响因子:5.6
发表时间:2021
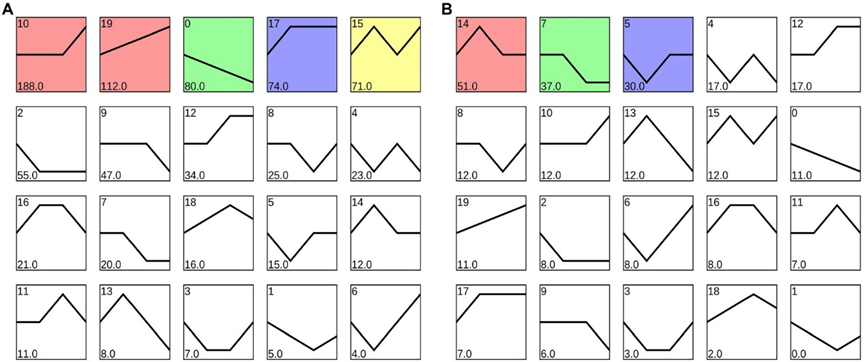
FIGURE 2. Trend analysis of the differentially expressed target genes of specific miRNAs in (A) roots and (B) leaves, and profiles are ordered based on the number of genes assigned.
引用方式:The trend analysis was performed using the OmicShare tools.
参考文献:
Nie G, Liao Z, Zhong M, et al. MicroRNA-mediated responses to chromium stress provide insight into tolerance characteristics of Miscanthus sinensis[J]. Frontiers in Plant Science, 2021, 12: 666117.
案例5:
发表期刊:Frontiers in Plant Science
影响因子:5.6
发表时间:2021
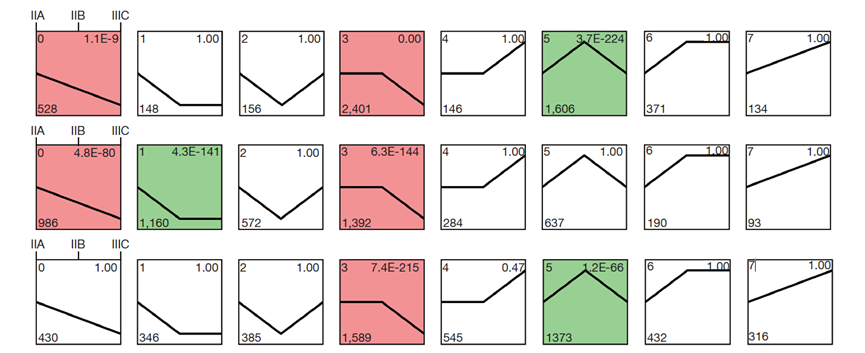
Figure 3 Trend analysis of colorectal cancer development at different stages of cancer progression. Each row in the figure represents the clustering results of each tissue type (seven profiles were obtained); from top to bottom: tumor tissues, paracancerous tissues, and normal tissues. The lower left corner number represents the number of metabolites with the trend, and the upper right corner represents the significant results of these metabolites clustering into the trend (colored trend indicates that the difference was statistically significant).
引用方式:Short Time-series Expression Mine software (STEM) (performed on OmicShare tools platform; www.omicshare.com/tools) simulates the possible change trends and then calculates the correlation coefficient between each factor and the preset trend, and divides the factors into the most similar trends. We preprocessed the data by log2 and set 1.2 as the minimum fold change of the trend. Finally, a Venn diagram was analyzed.
参考文献:
Lin L, Zeng X, Liang S, et al. Biomarkers of coordinate metabolic reprogramming and the construction of a co-expression network in colorectal cancer[J]. Annals of Translational Medicine, 2022, 10(20).
案例6:
发表期刊:Frontiers in Genetics
影响因子:3.7
发表时间:2022
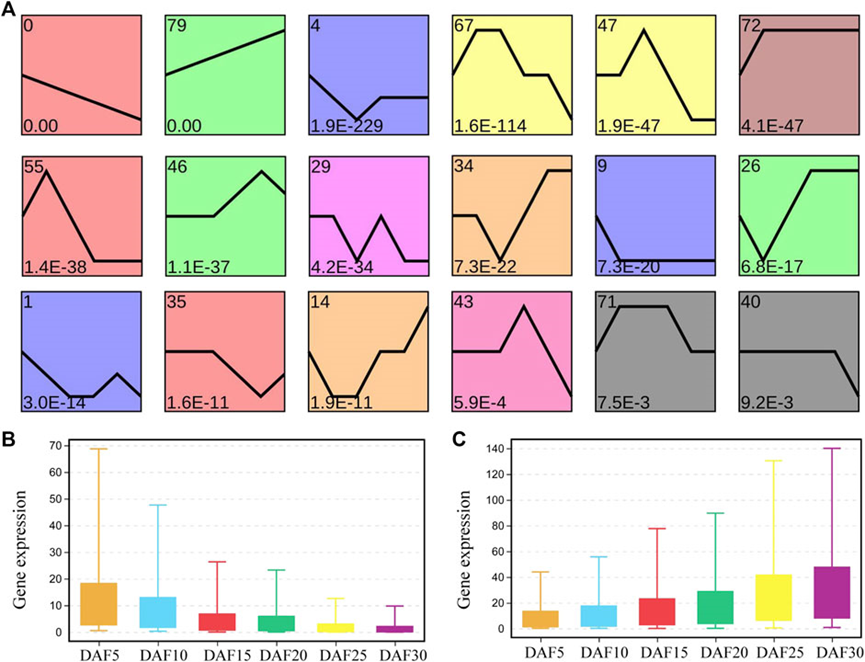
FIGURE 2. Analysis of gene expression trend in fruit tissue at six developmental stages. (A). Profiles are ordered based on the p-value significance of gene assigned. (B). The level of the gene expression at six developmental stages in profile 0. (C). The level of gene expression at six developmental stages in profile 79.
引用方式:
The gene expression levels in each sample were converted into a data matrix, and PCA was analyzed using the OmicShare tools, a free online platform for data analysis (https://www.omicshare.com/tools). A p-value of 0.05 and the absolute value of |log2 (Fold Change)| ≥ 1 were set as the threshold for significantly differential expression (Audic and Claverie, 1997).
To investigate patterned differences in expression profiles during fruit developmental stages, we analyzed dynamic expression trends of genes using the OmicShare tools. Gene expression was normalized with log2(FC) and gene expression trends were set to 80 profiles using the Dynamic Trend Analysis tool with a p-value of significant expression trend < 0.05 and change multiple > 2. We extracted the expression of all genes in the significant profiles.
参考文献:
Hu P, Zhao M, Chen S, et al. Transcriptional regulation mechanism of flavonoids biosynthesis gene during fruit development in Astragalus membranaceus[J]. Frontiers in Genetics, 2022, 13: 972990.
其他参考文献:
Wang T, Xing L, Song H, et al. Large-scale metabolome analysis reveals dynamic changes of metabolites during foxtail millet grain filling[J]. Food Research International, 2023, 165: 112516.
Wang T, Xing L, Song H, et al. Large-scale metabolome analysis reveals dynamic changes of metabolites during foxtail millet grain filling[J]. Food Research International, 2023, 165: 112516.
案例7:
发表期刊:Ecotoxicology and Environmental Safety
影响因子:6.8
发表时间:2023
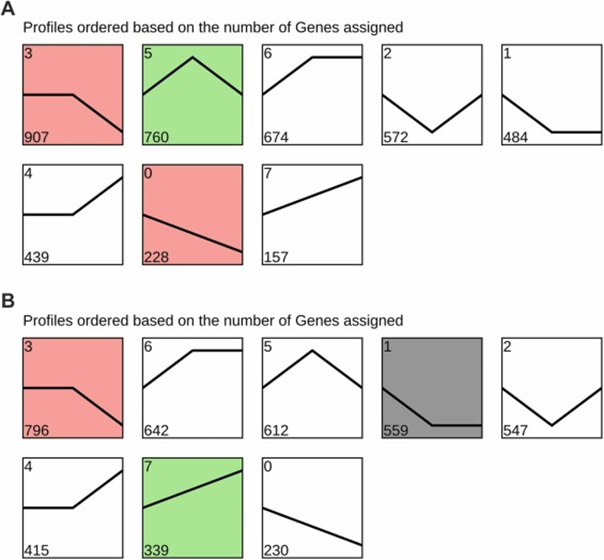
Fig. 2. Series test of cluster (STC) analysis of experiment A and experiment B DEGs. The STC result of experiment A DEGs was listed on the left (A), and the STC result of experiment B DEGs was listed on the right (B). The number on the upper left of the box denoted different trend profiles. The number on the bottom of the box denoted gene numbers enriched in this profile, and different color boxes indicated significant expression patterns (P < 0.05).
参考文献:
Yu H, Song W, Chen X, et al. Transcriptomic analysis reveals up-regulated histone genes may play a key role in zebrafish embryo-larvae response to Bisphenol A (BPA) exposure[J]. Ecotoxicology and Environmental Safety, 2023, 252: 114578.