


 扫码支付更轻松

1.功能
输入关联分析数据或其他数据绘制桑基图,支持双坐标轴、三坐标轴、四坐标轴、五坐标轴等多轴类型的桑基图。

2. 应用范围
关系流动数据,如:编码RNA与非编码RNA数据、细胞分群与细胞类型等,或其他行业数据。
3. 输入文件
支持txt(制表符分隔)文本文件、csv(逗号分隔)文本文件、以及Excel专用的xlsx格式,同样支持旧版Excel的xls(Excel 97-2003 )格式。
绘制几坐标桑基图,就输入几列数据,同时最后一列必须为数值。
双坐标轴格式如下:
|
cluster |
celltype |
Freq |
|
0 |
B cells |
1 |
|
0 |
Basophils |
0 |
|
0 |
CD4+ T cells |
5 |
|
0 |
Eosinophils |
7 |
|
1 |
GMPs |
21 |
|
1 |
B cells |
4 |
|
1 |
Granulocytes |
7 |
|
1 |
HSCs |
32 |
|
1 |
MEPs |
3 |
|
1 |
NK cells |
12 |
|
2 |
Basophils |
32 |
|
…… |
…… |
…… |
说明:第一列表示细胞分群,第二列表示细胞类型,第三列表示某一分群中的某一细胞数量
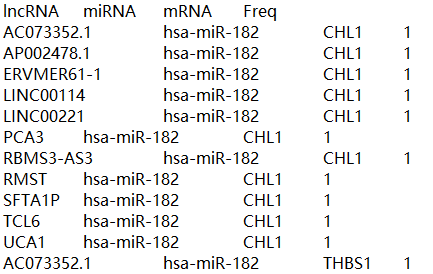
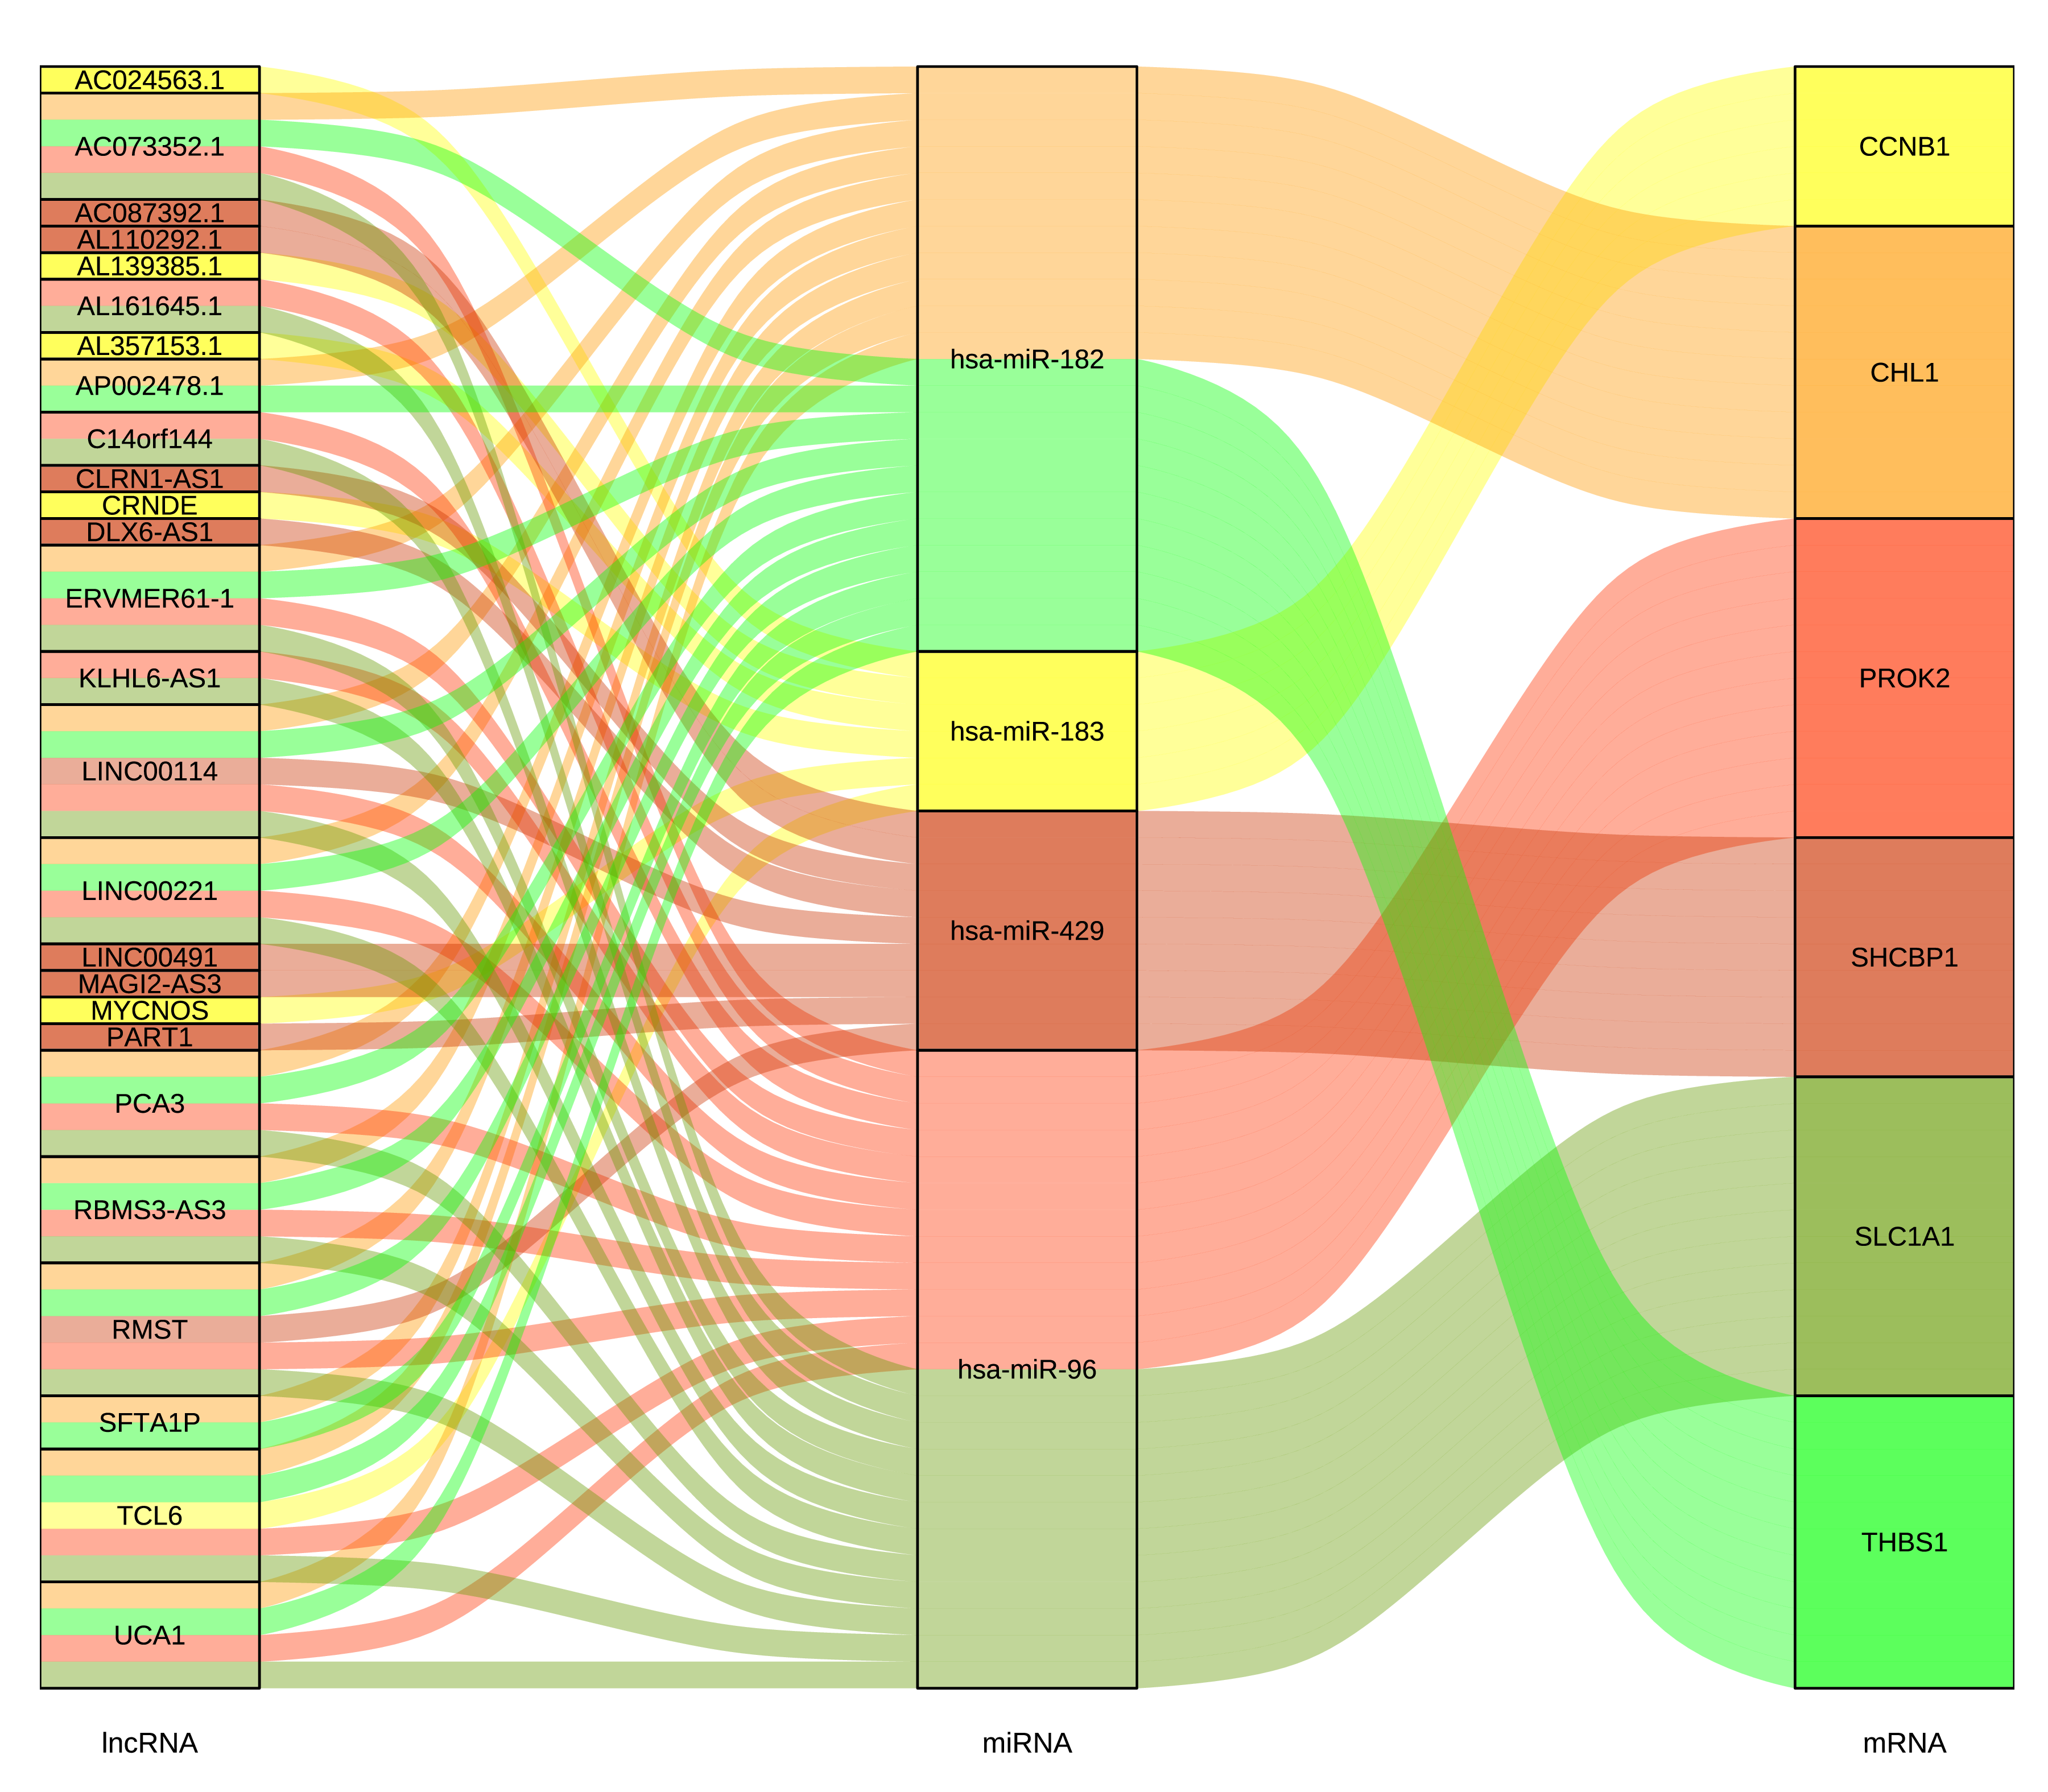
三坐标轴格式如下:
|
lncRNA |
miRNA |
mRNA |
Freq |
|
AC073352.1 |
hsa-miR-182 |
CHL1 |
1 |
|
AP002478.1 |
hsa-miR-182 |
CHL1 |
1 |
|
ERVMER61-1 |
hsa-miR-182 |
CHL1 |
1 |
|
LINC00114 |
hsa-miR-182 |
CHL1 |
1 |
|
LINC00221 |
hsa-miR-182 |
CHL1 |
1 |
|
PCA3 |
hsa-miR-182 |
CHL1 |
1 |
|
RBMS3-AS3 |
hsa-miR-182 |
CHL1 |
1 |
|
RMST |
hsa-miR-182 |
CHL1 |
1 |
|
SFTA1P |
hsa-miR-182 |
CHL1 |
1 |
|
…… |
…… |
…… |
…… |
4. 参数
配色选择:选择下拉框的几种配色绘图
自定义颜色:在右边颜色框中选择想要绘图的颜色,建议选择3种或更多
透明度:定义条带的透明度,值越小越透明
条带变化曲率:表示条带的弯曲程度。值越小,表示条带弯曲程度越小,等于0时,没有弯曲度;值越大,表示条带弯曲程度越大
方格宽度:根据轴标签字符串长度自定义,如:gene id越长,方格长度也要相应越宽,否则标签超出轴方格宽度,输出图形不好看
标签字体:指方格中的标签字体大小,如:gene id的字体大小。
轴标签字体:指各个轴的标签字体,如:第一列为lncRNA,第二列为miRNA,第三列为mRNA
标题:自定义给桑基图添加图形标题
5. 输出
点击下载,解压后有pdf和png格式的图形
如图所示:
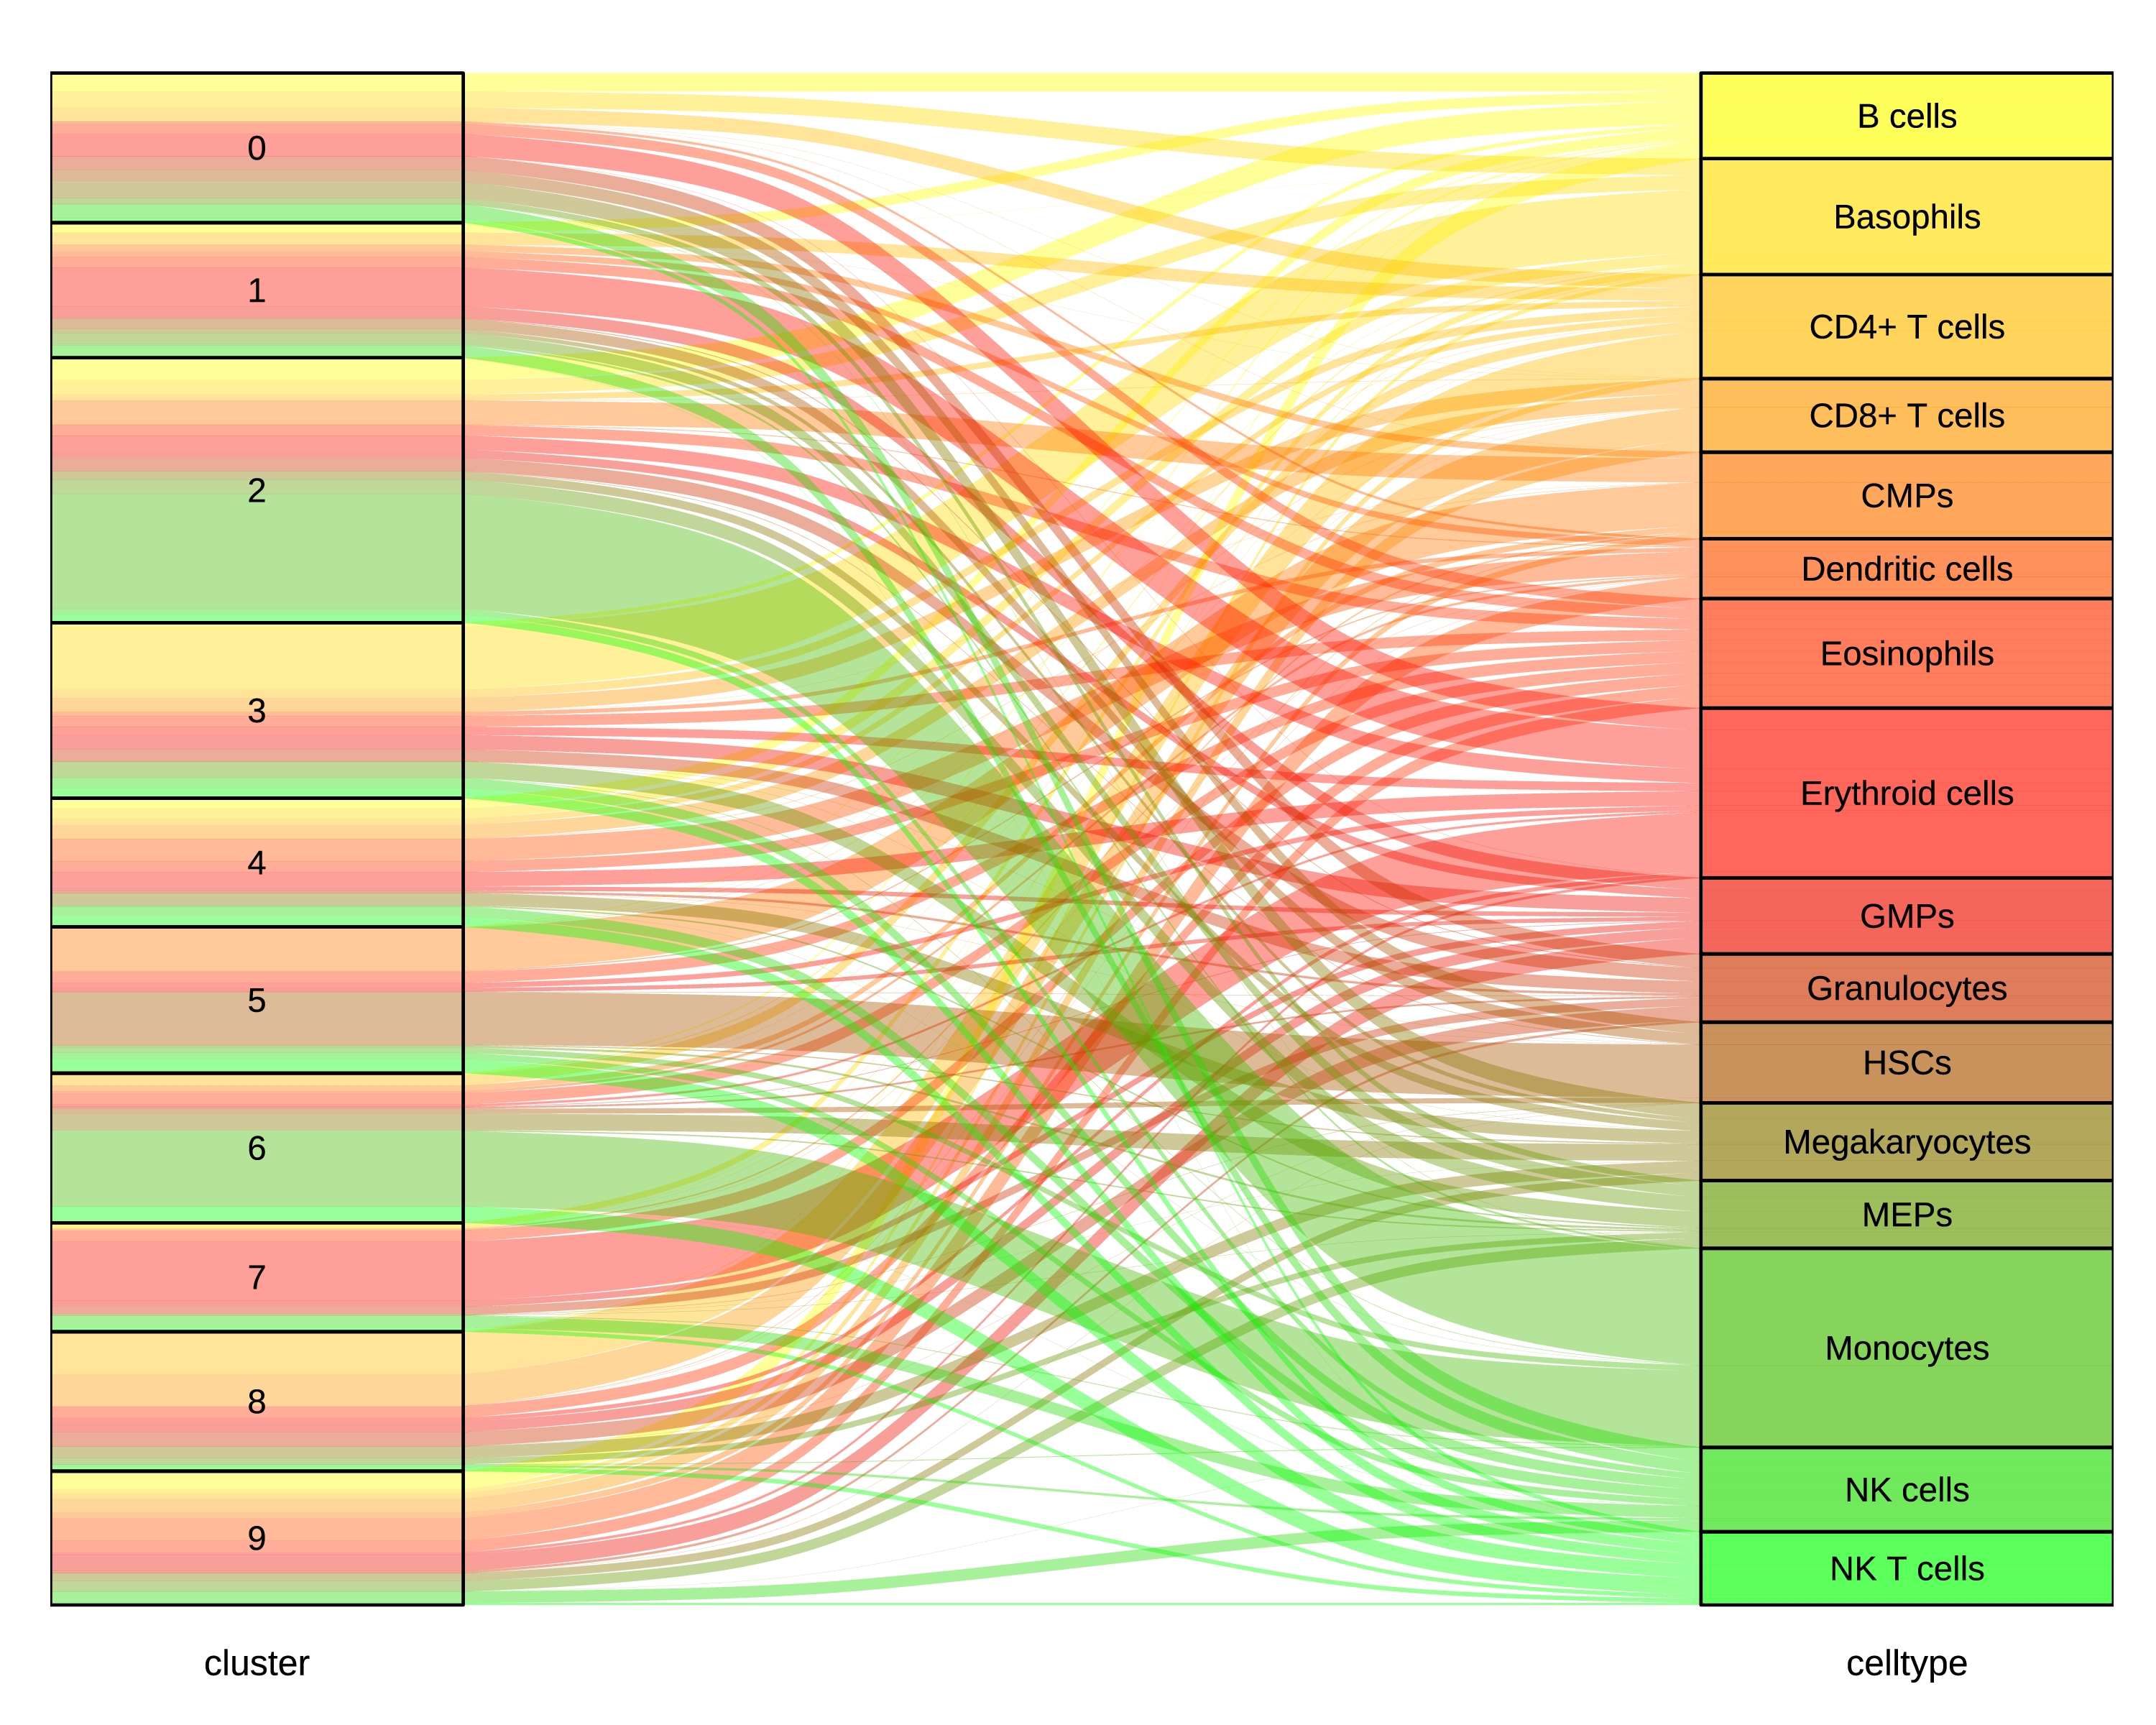
双坐标轴桑基图
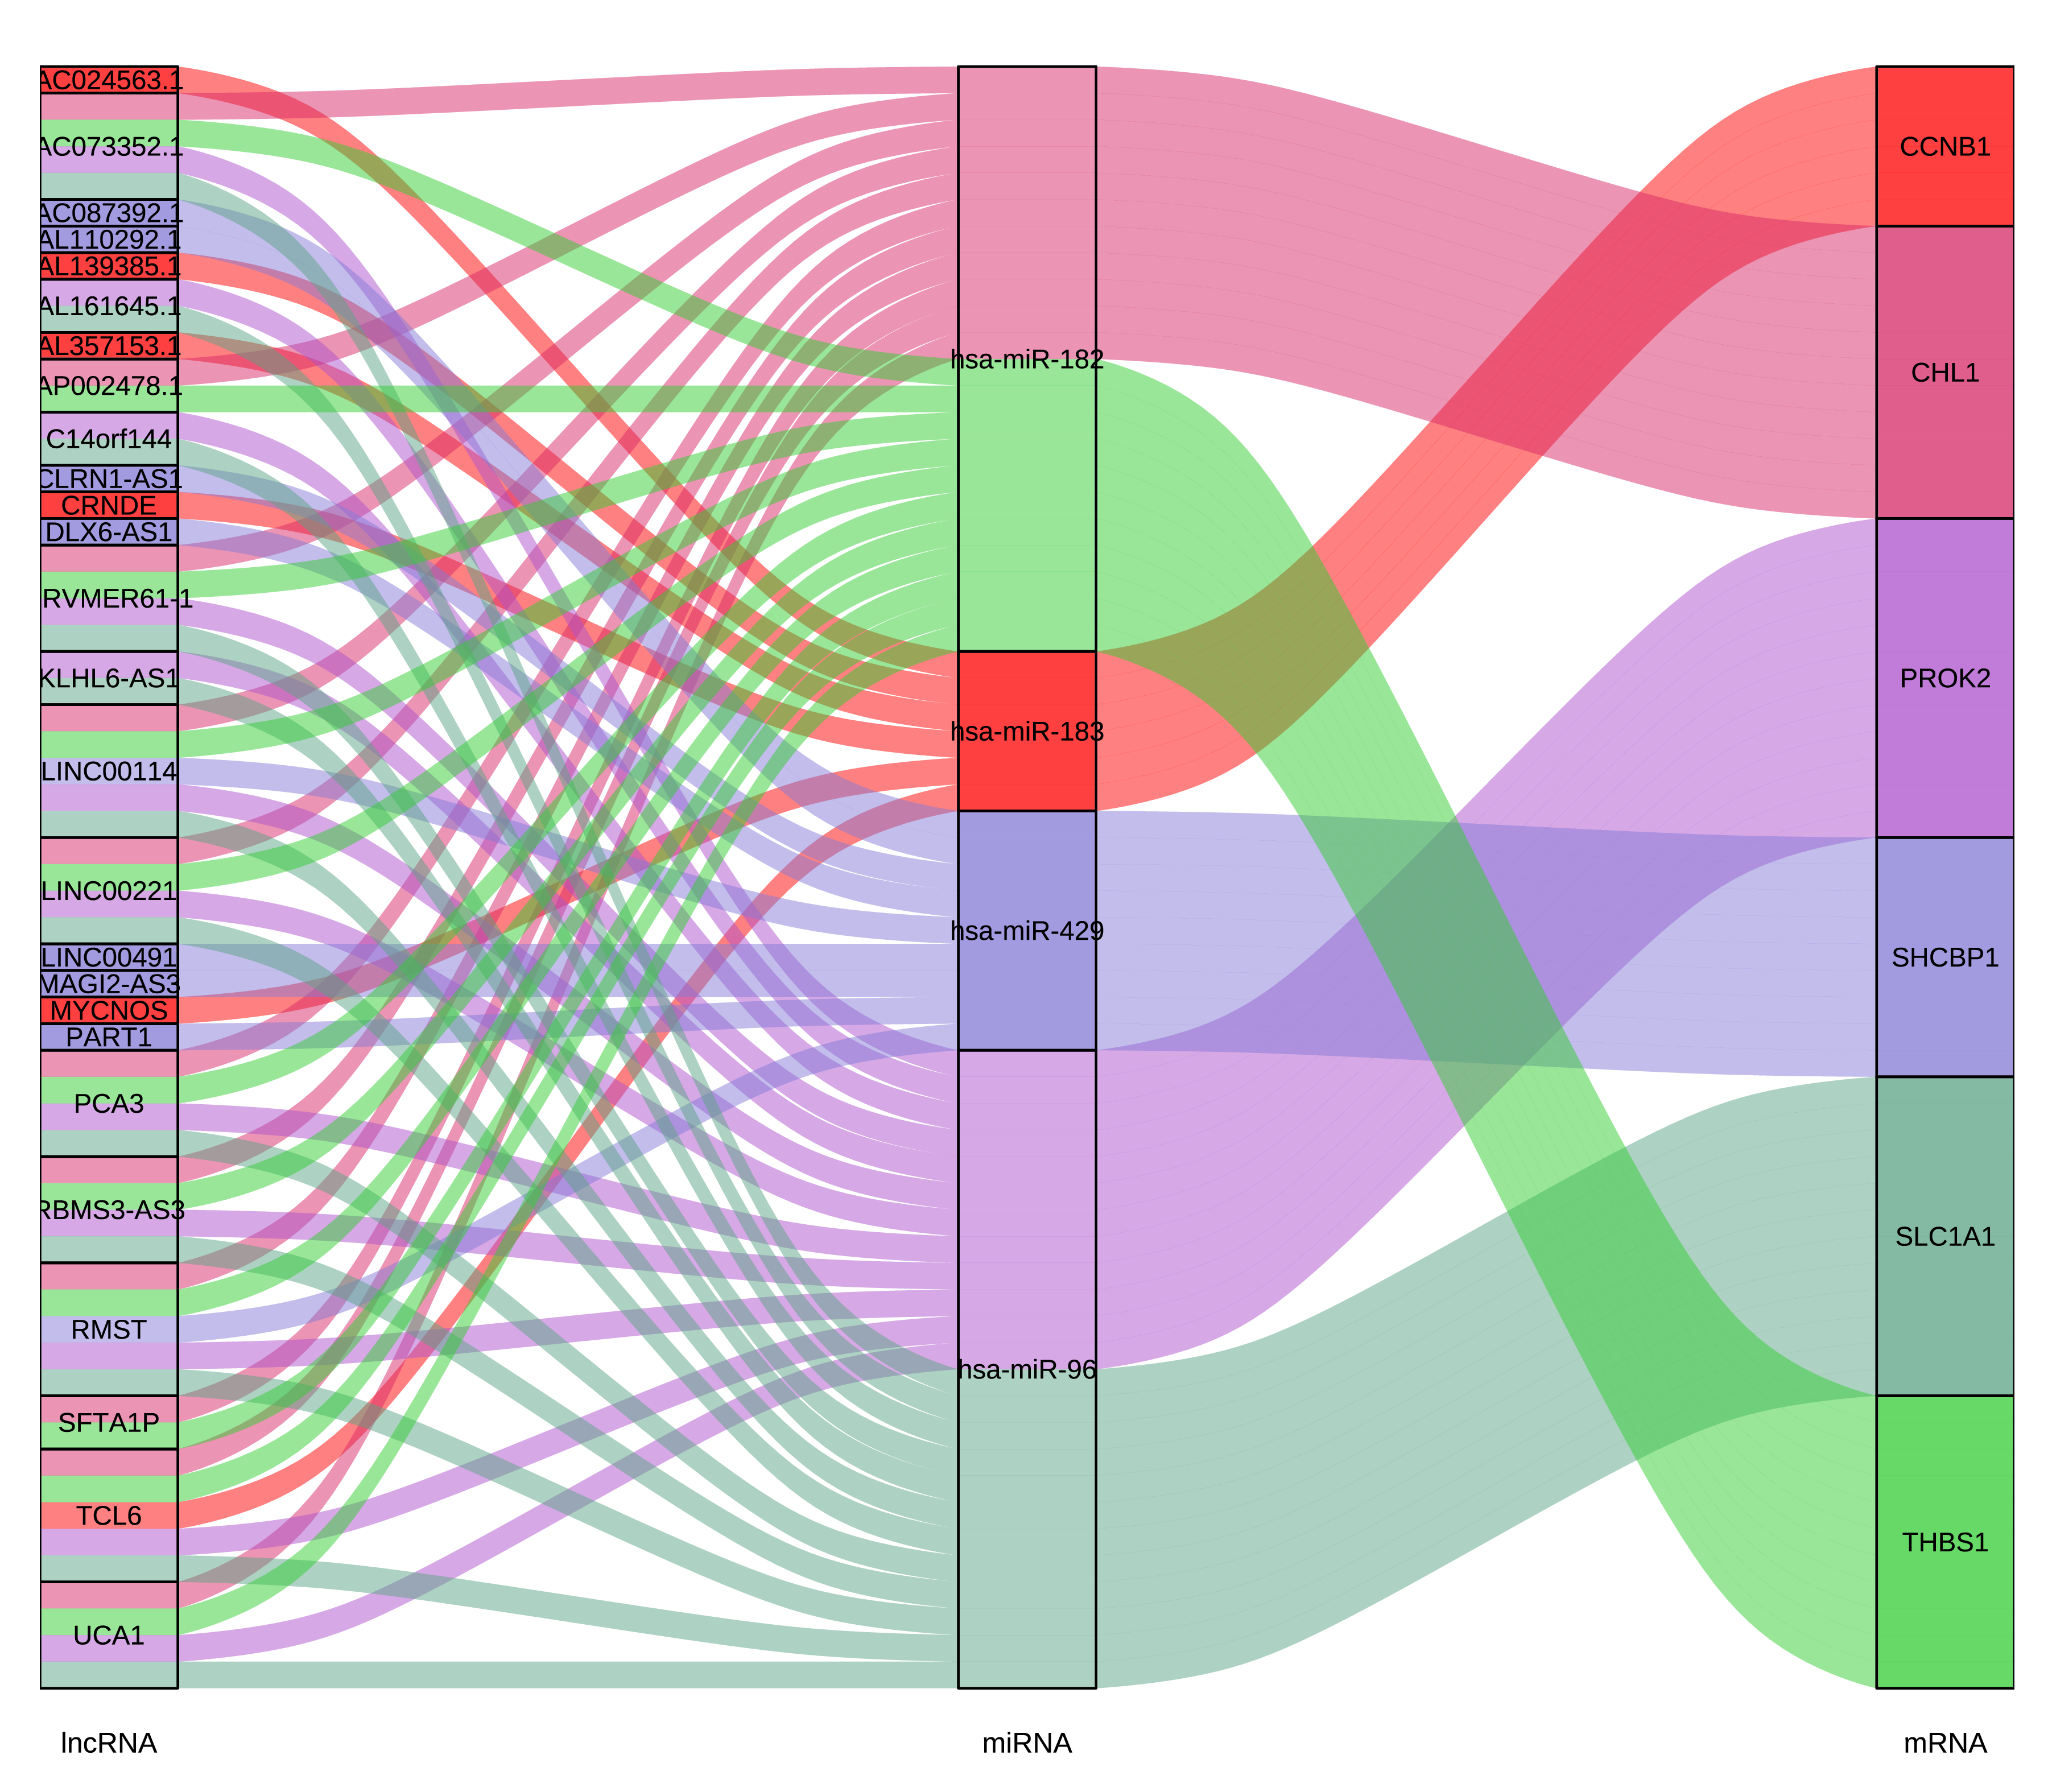
三坐标轴桑基图
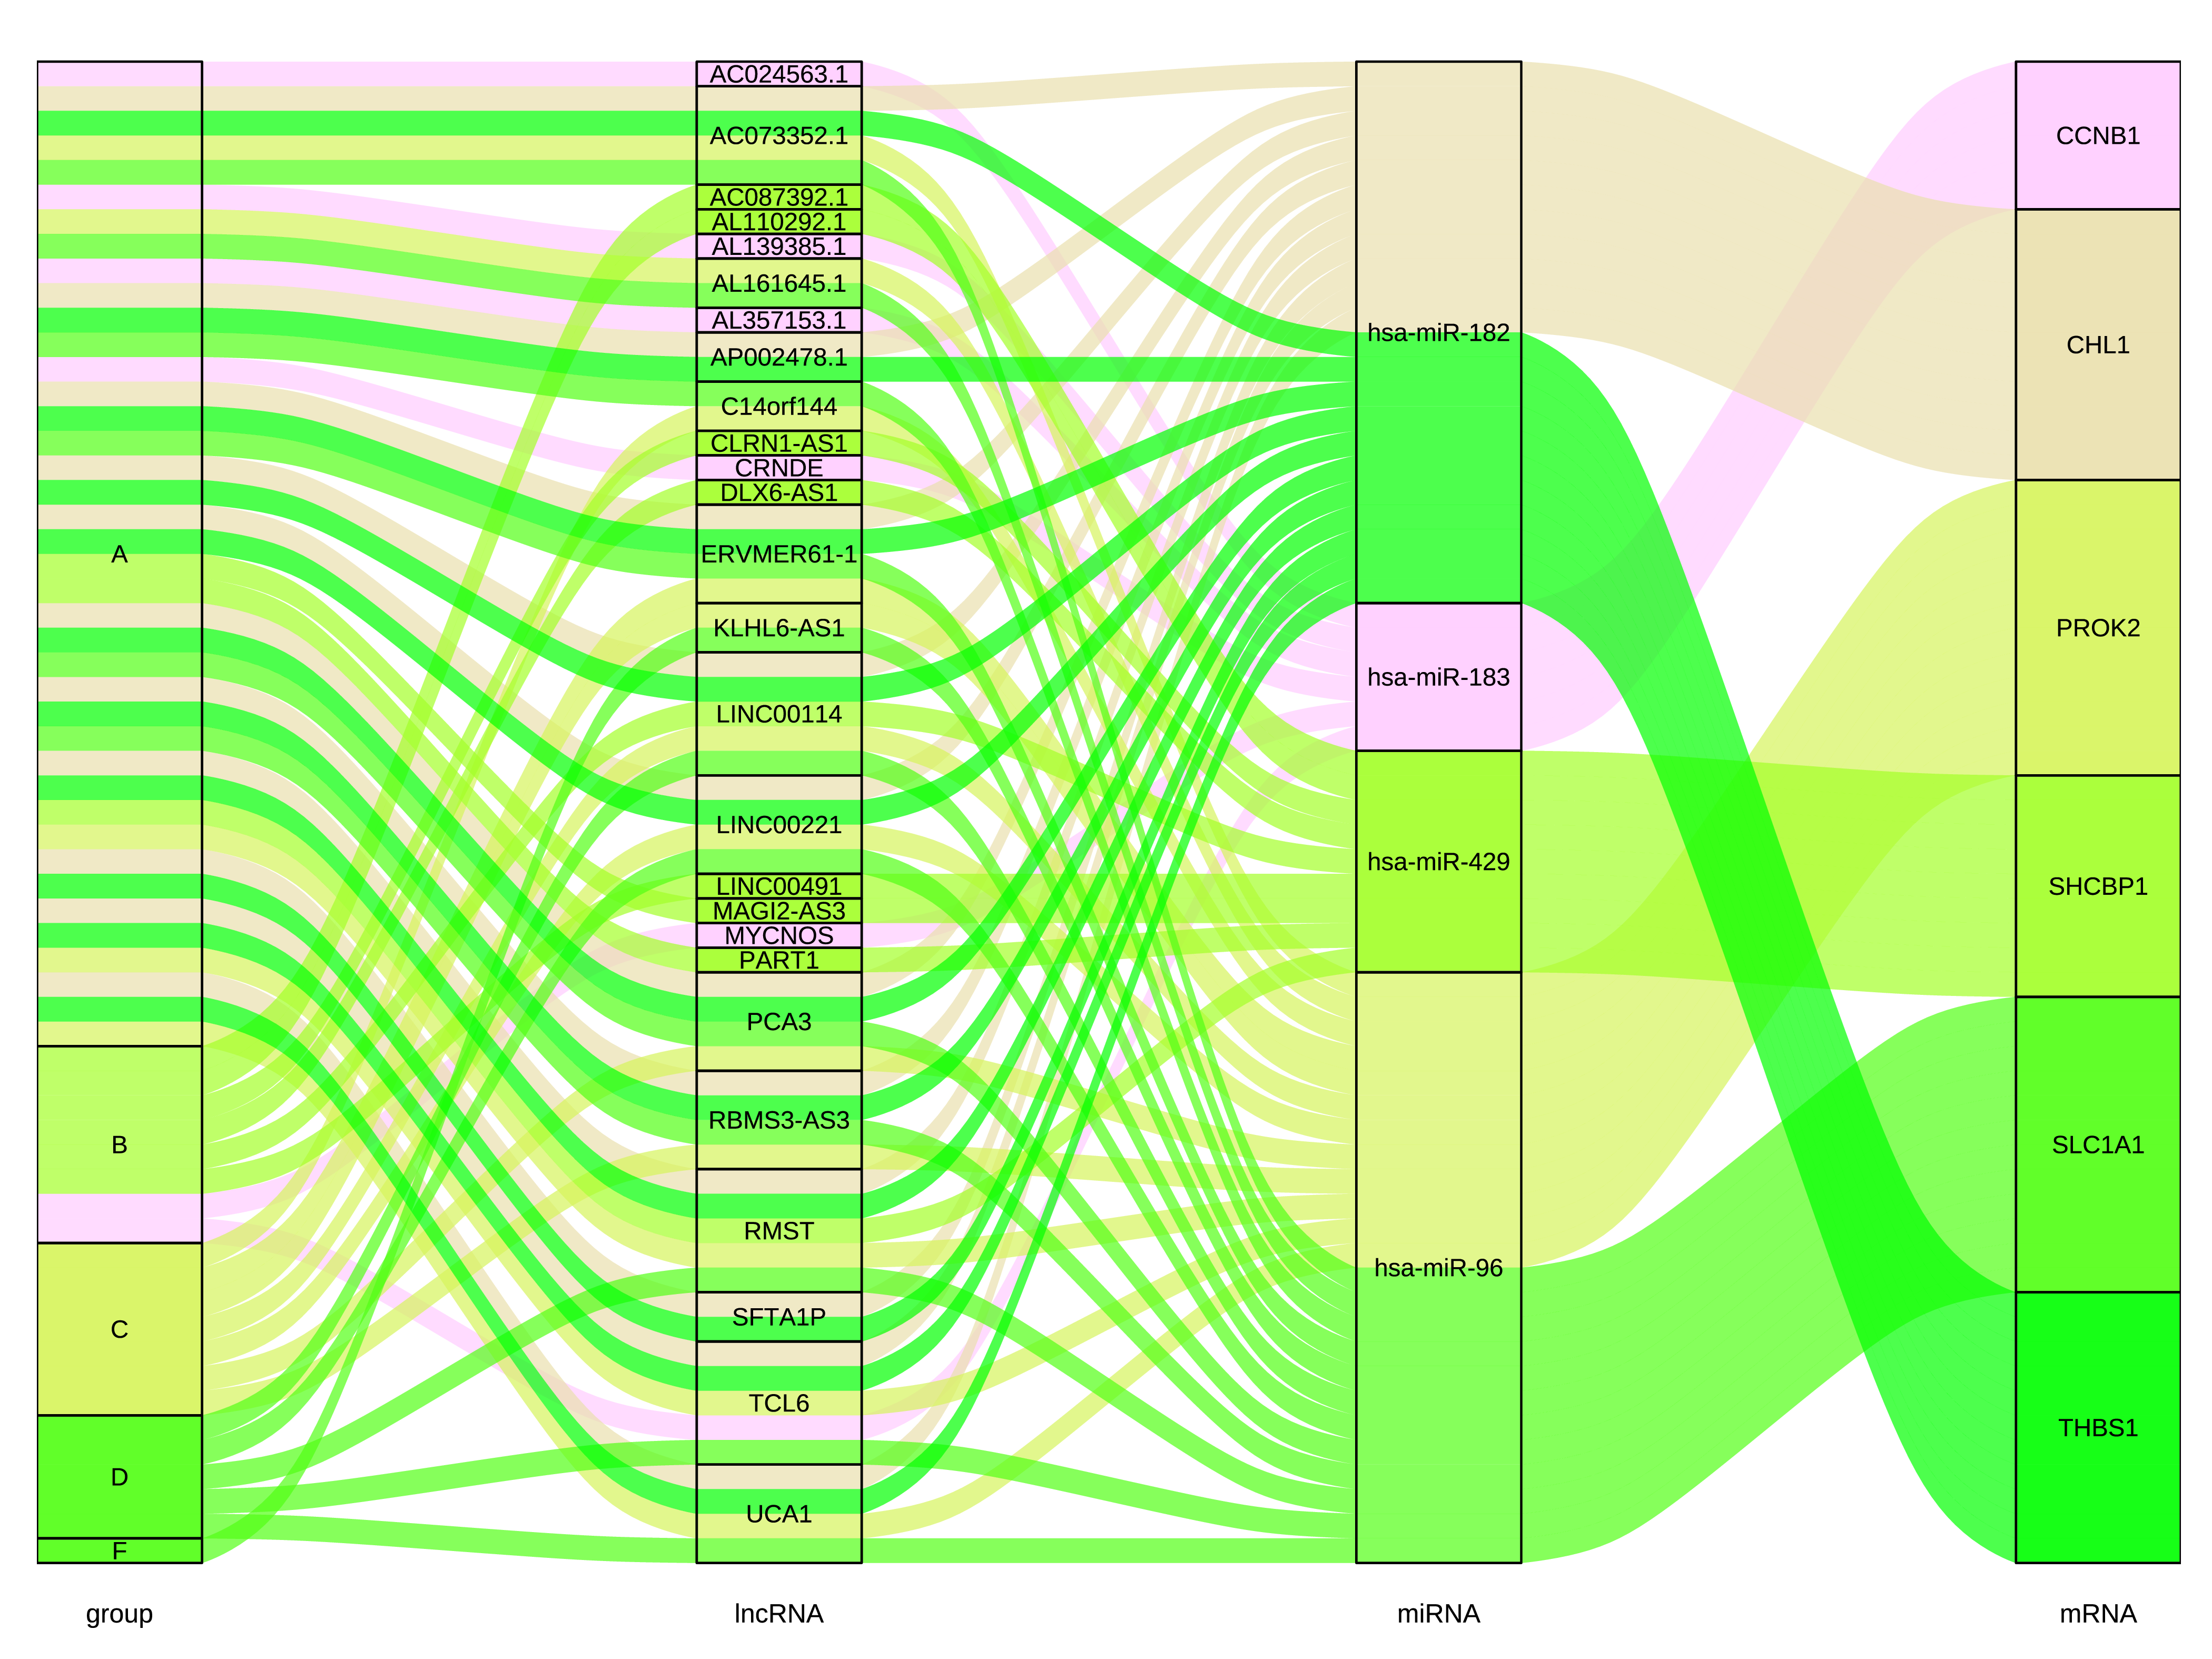
四坐标轴桑基图
Q1. 上传的数据需要保存成什么格式?文件名称和拓展名有没有要求?
OmicShare当前支持txt(制表符分隔)文本文件、csv(逗号分隔)文本文件、以及Excel专用的xlsx格式,同样支持旧版Excel的xls(Excel 97-2003 )格式。如果是核酸、蛋白序列文件,必须为FASTA格式(本质是文本文件)。
文件名可由英文和数字构成,文件拓展名没有限制,可以是“.txt”、“.xlsx”、“.xls”、“.csv”“.fasta”等,例如 mydata01.txt,gene02.xlsx 。
Q2. 提交时报错常见问题:
1.提交时显示X行X列空行/无数据,请先自查表格中是否存在空格或空行,需要删掉。
2.提交时显示列数只有1列,但表格数据不止1列:列间需要用分隔符隔开,先行检查文件是否用了分隔符。
其它提示报错,请先自行根据提示修改;如果仍然无法提交,可通过左侧导航栏的“联系客服”选项咨询OmicShare客服。
Q3. 提交的任务完成后却不出图该怎么办?
主要原因是上传的数据文件存在特殊符号所致。可参考以下建议逐一排查出错原因:
(1)数据中含中文字符,把中文改成英文;
(2) 数据中含特殊符号,例如 %、NA、+、-、()、空格、科学计数、罗马字母等,去掉特殊符号,将空值用数字“0”替换;
(3)检查数据中是否有空列、空行、重复的行、重复的列,特别是行名(一般为gene id)、列名(一般为样本名)出现重复值,如果有删掉。
排查完之后,重新上传数据、提交任务。如果仍然不出图,可通过左侧导航栏的“联系客服”选项咨询OmicShare客服。
Q4.下载的结果文件用什么软件打开?
OmicShare云平台的结果文件(例如,下图为KEGG富集分析的结果文件)包括两种类型:图片文件和文本文件。

图片文件:
为了便于用户对图片进行后期编辑,OmicShare同时提供位图(png)和矢量图(pdf、svg)两种类型的图片。对于矢量图,最常见的是pdf和svg格式,常用Ai(Adobe illustrator)等进行编辑。其中,svg格式的图片可用网页浏览器打开,也可直接在word、ppt中使用。
文本文件:
文本文件的拓展名主要有4种类型:“.os”、“.xls”、“.log”和“.txt”。这些文件本质上都是制表符分隔的文本文件,使用记事本、Notepad++、EditPlus、Excel等文本编辑器直接打开即可。结果文件中,拓展名为“.os”文件为上传的原始数据;“.xls”文件一般为分析生成的数据表格;“.log”文件为任务运行日志文件,便于检查任务出错原因。
Q5. 提交的任务一直在排队怎么办?
提交任务后都需要排队,1分钟后,点击“任务状态刷新”按钮即可。除了可能需运行数天的注释工具,一般工具数十秒即可出结果,如果超出30分钟仍无结果,请联系OS客服,发送任务编号给OmicShare客服,会有专人为你处理任务问题。
Q6. 结果页面窗口有问题,图表加载不出来怎么办?
尝试用谷歌浏览器登录OmicShare查看结果文件,部分浏览器可能不兼容。
引用OmicShare Tools的参考文献为:
Mu, Hongyan, Jianzhou Chen, Wenjie Huang, Gui Huang, Meiying Deng, Shimiao Hong, Peng Ai, Chuan Gao, and Huangkai Zhou. 2024. “OmicShare tools: a Zero‐Code Interactive Online Platform for Biological Data Analysis and Visualization.” iMeta e228. https://doi.org/10.1002/imt2.228案例1:
发表期刊:Biology
影响因子:4.2
发表时间:2022
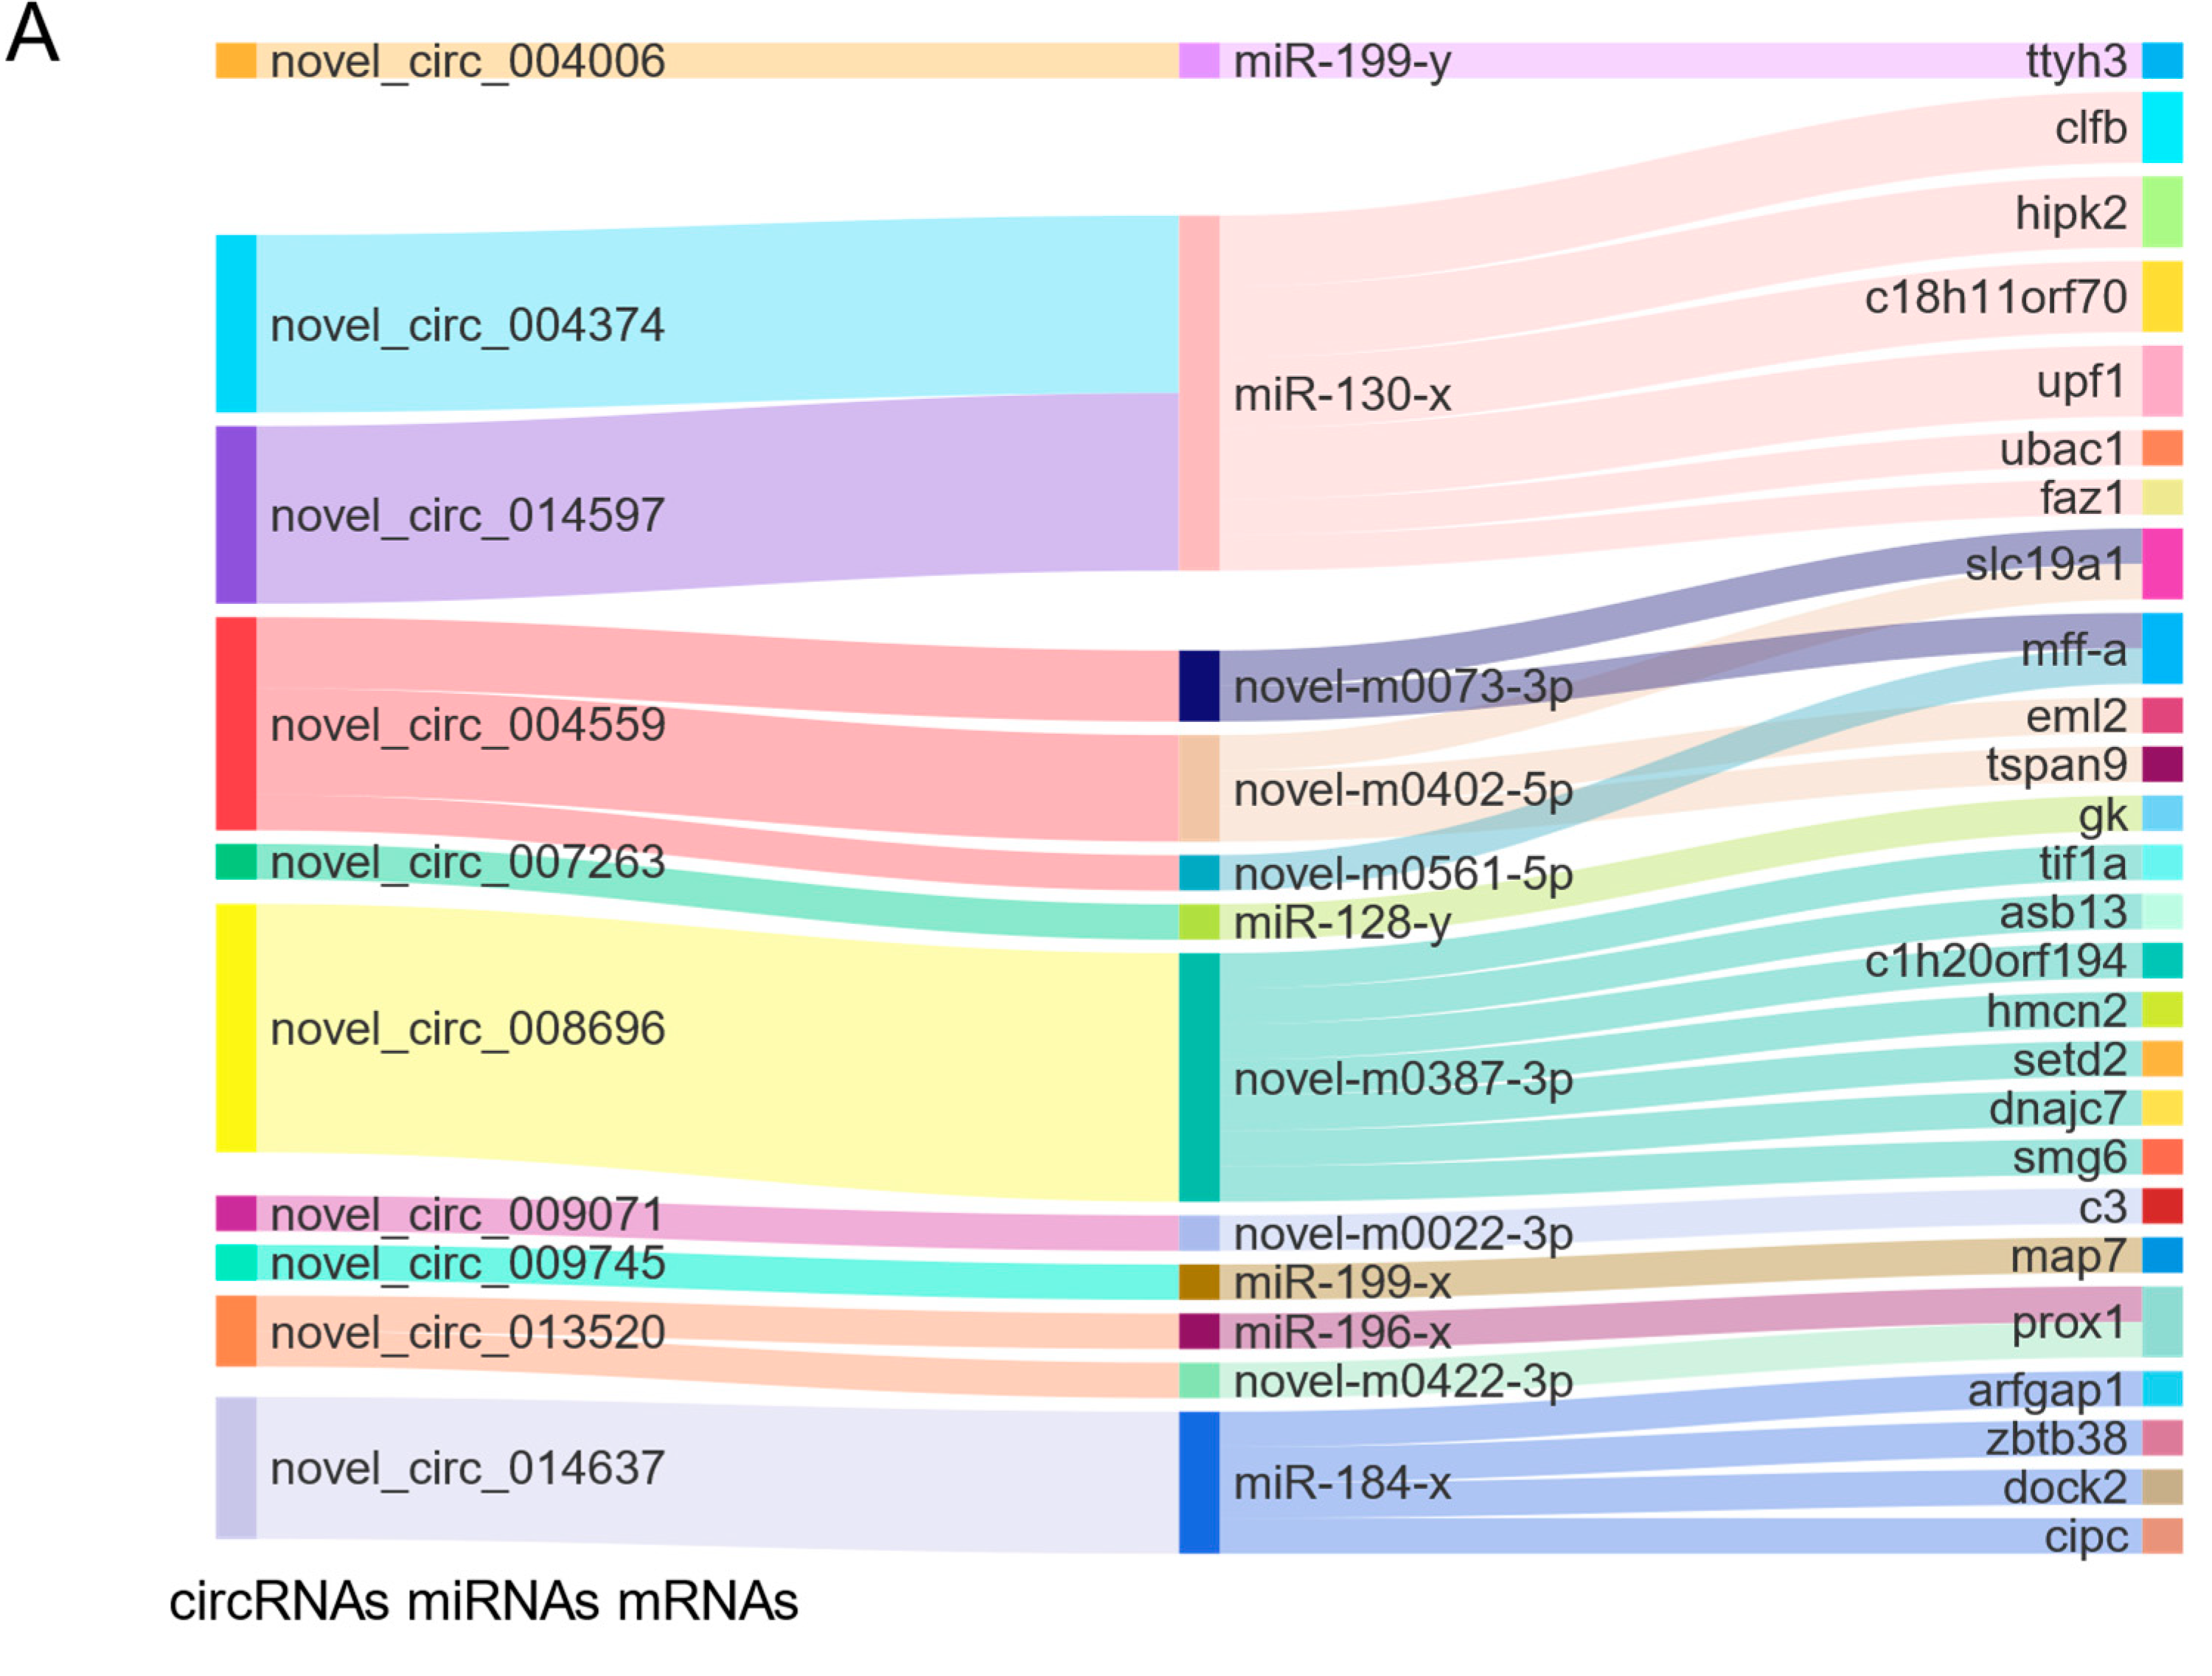
Figure 5. Functional circRNA–miRNA–mRNA regulatory module and the different expression of circRNAs in males, females, and pseudo males. (A) The circRNAs, miRNAs, and mRNAs are on the left, middle, and right, respectively.
引用方式:The Sankey diagram and circRNA expression heatmap were made with OmicShare tool, a free online platform for data analysis (www.omicshare.com/tools, accessed on 6 March 2022)..
参考文献:
Gong Z, Shi R, Chen S, et al. CircRNA Identification and CircRNA–miRNA–mRNA Network in Cynoglossus semilaevis Sexual Size Dimorphism[J]. Biology, 2022, 11(10): 1451.
案例2:
发表期刊:Frontiers in Genetics
影响因子:3.7
发表时间:2022
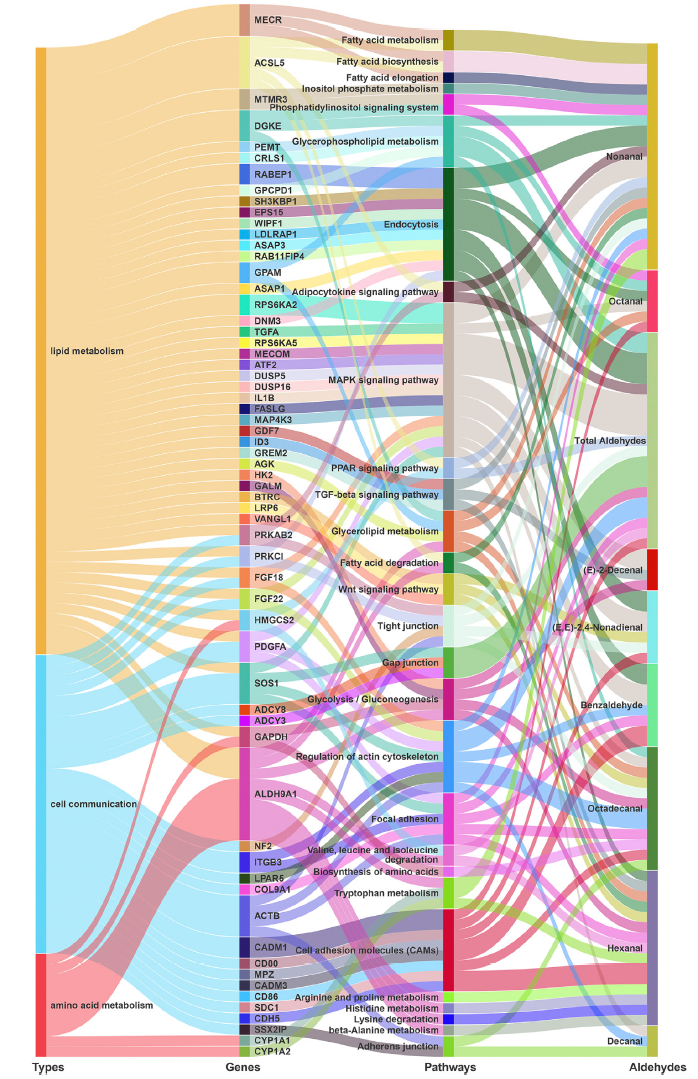
FIGURE 2. KEGG (kyoto encyclopedia of genes and genomes) pathway enrichment analyses for GWAS annotation. Sankey diagrams showing that potential genes from GWAS jointly participate in lipid metabolism, cell communication, and amino acid metabolism pathways.

FIGURE 3. GO term enrichment analyses for GWAS annotation. Sankey diagrams showing that potential genes from GWAS participate in phospholipid and lipid related GO terms.
引用方式:Sankey diagrams were generated using the OmicShare tools (https://www.omicshare.com/tools).
参考文献:
Yuan X, Cui H, Jin Y, et al. Fatty acid metabolism-related genes are associated with flavor-presenting aldehydes in Chinese local chicken[J]. Frontiers in Genetics, 2022, 13: 902180.
案例3:
发表期刊:Molecular Medicine Reports
影响因子:3.4
发表时间:2022
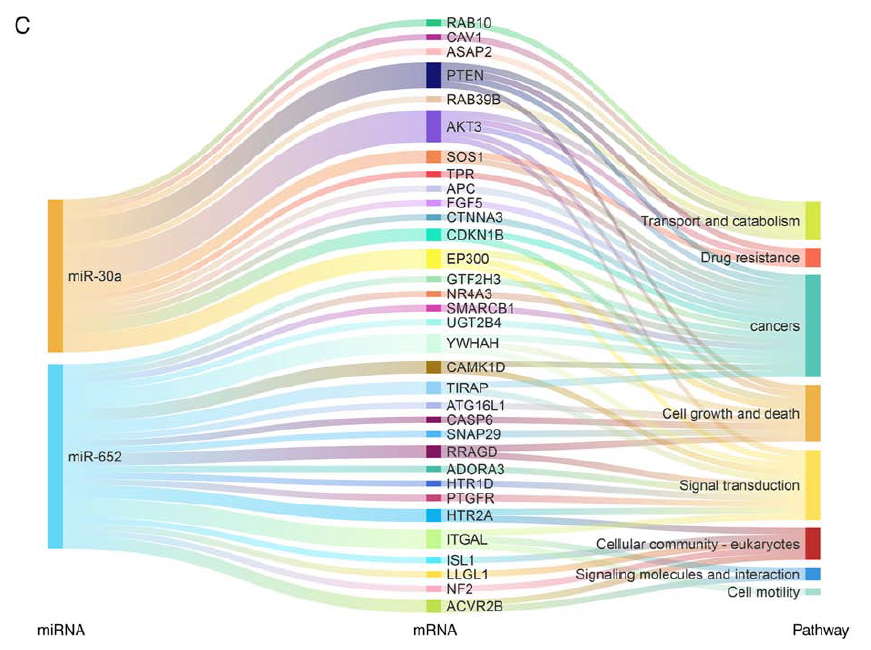
Figure 6. Target analysis of miR‑652 and miR‑30a. (C) Sankey map of target genes of miR‑30a and miR‑652 in different pathways. miR, microRNA .
引用方式:Volcano map, radar map, Circular map, heatmap, Lollipop chart and Sankey diagram construction were performed using the OmicShare tools, a free online platform for data analysis (https://www.omicshare.com/tools).
参考文献:
Miao N, Cai W, Ding S, et al. Characterization of plasma exosomal microRNAs in responding to radiotherapy of human esophageal squamous cell carcinoma[J]. Molecular Medicine Reports, 2022, 26(3): 1-13.
案例4:
发表期刊:Elife
影响因子:7.7
发表时间:2022
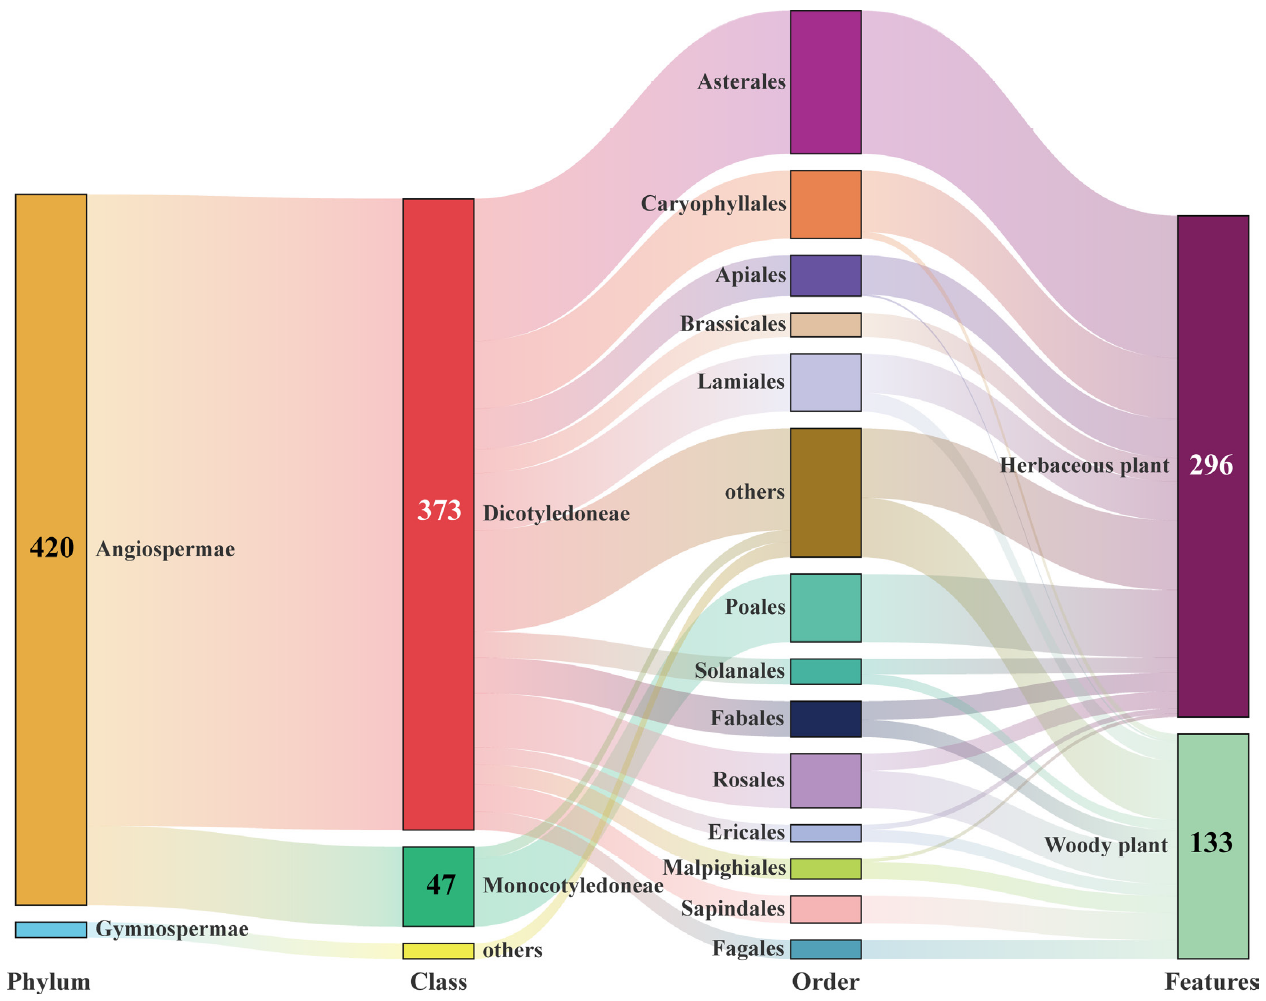
Figure 7. Sankey diagram summarizing the host plants of E. balteatus, as identified via DNA metabarcoding (i.e., for BH migrant individuals) or DNA-based gut content analysis (i.e., for field-collected individuals from 19 sites).
引用方式:Venn and upset diagrams were drawn to represent the interactions among host plant communities of different groups using the omicshare cloud tool under default instructions (http://www.omicshare.com/).
参考文献:
Jia H, Liu Y, Li X, et al. Windborne migration amplifies insect-mediated pollination services[J]. Elife, 2022, 11: e76230..
案例5:
发表期刊:Journal of Hazardous Materials
影响因子:13.6
发表时间:2023
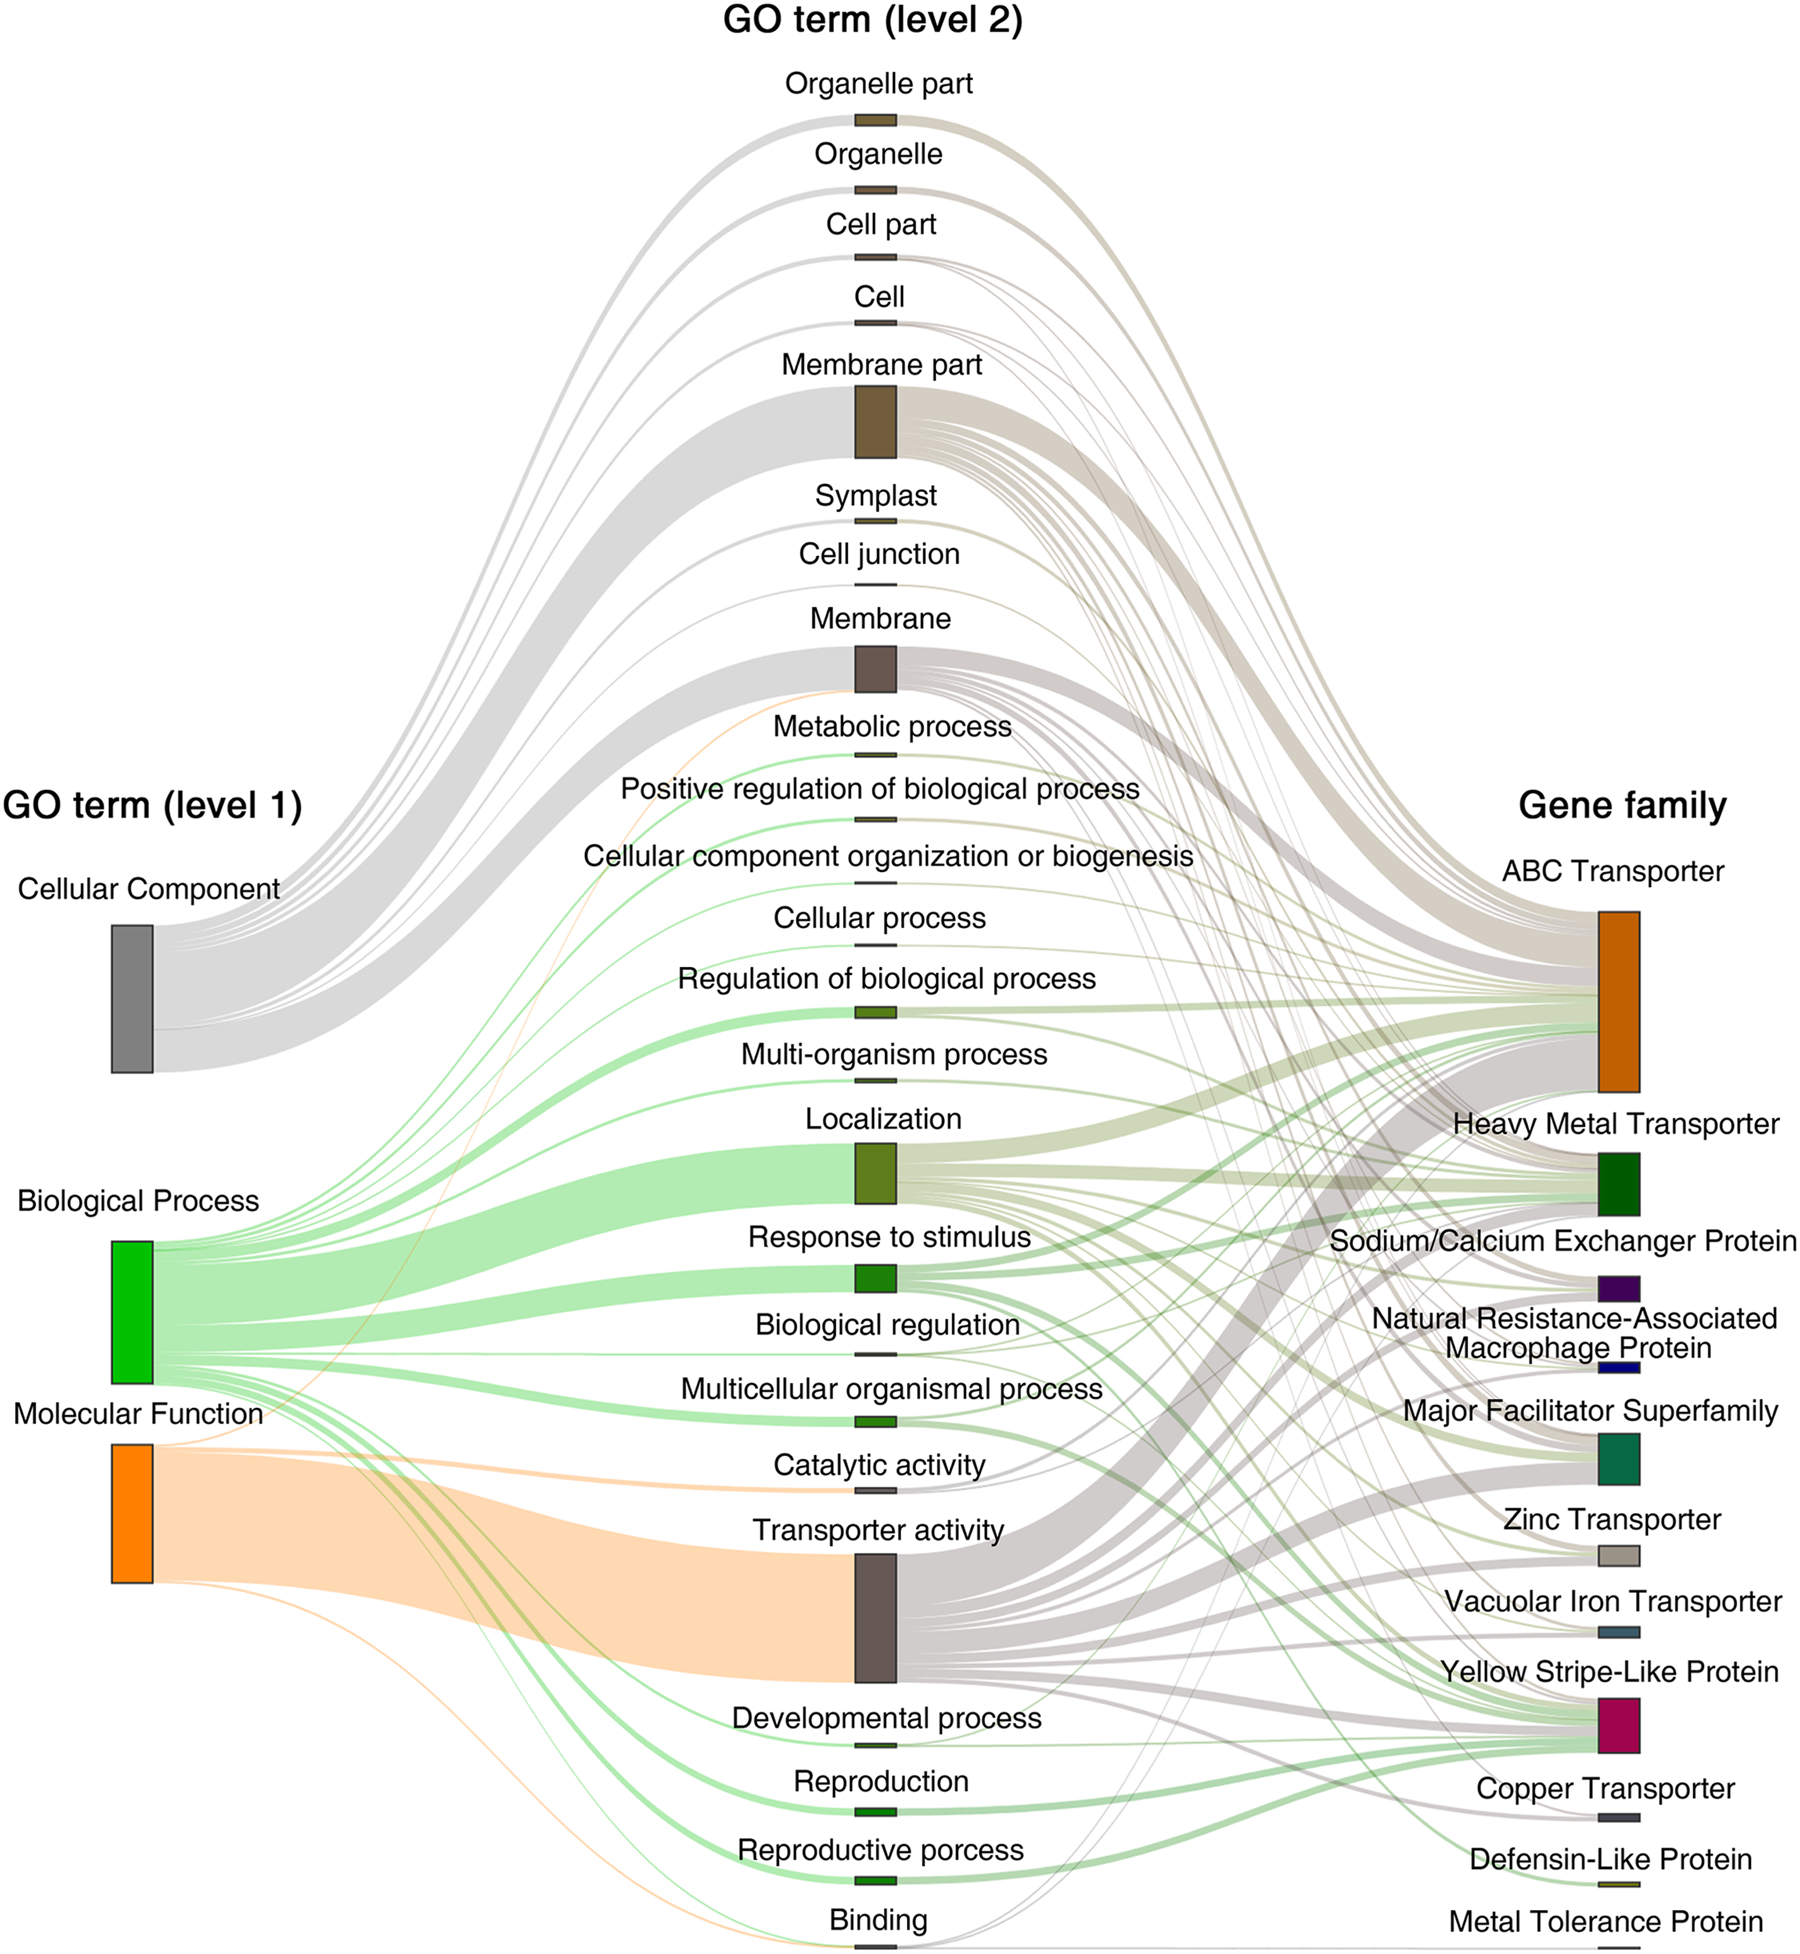
Fig 6. Sankey diagram of GO annotation and important gene families associated with ZmKCd_GP SNPs The block on the left represents the GO term (level 1), the block in the middle represents the GO term (level 2), and the block on the right represents the Cd-related gene family. The branches indicate the source of GO term for each gene family.
引用方式:GO enrichment analysis was performed and generated with OmicShare tools, a free online platform for data analysis (https://www.omicshare.com/tools). Sankey diagrams are made by Python 3.10.4 for windows (https://www.python.org/).
参考文献:
Yan H, Guo H, Xu W, et al. GWAS-assisted genomic prediction of cadmium accumulation in maize kernel with machine learning and linear statistical methods[J]. Journal of Hazardous Materials, 2023, 441: 129929.