


 扫码支付更轻松

1. 查看任务

2. 参数调整

3. 图形尺寸调整/下载

1. 功能
对一个带表头的表格数据(如基因表达量数据等)进行主成分分析(PCA),并将数据降维到2维或3维空间,以便在散点图中展示。支持2D或3D的PCA散点图绘制与美化。
通过PCA散点图,可以直观观察不同样本(如不同组织、处理条件或时间点)在主成分空间中的分布,帮助我们:揭示样本间差异、识别群组间的差异或相似性、监测异常值或离群点等。
2. 适用范围
适用于基因表达、16s多样性分析、重测序等基于各类变量信息(如各个基因表达量、各个菌落丰度、SNP的基因型值)的样本聚类。
3. 输入
文件格式:支持txt(制表符分隔)文本文件、csv(逗号分隔)文本文件、以及Excel专用的xlsx格式,同样支持旧版Excel的xls(Excel 97-2003 )格式。
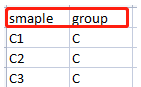
数据格式:需提供矩阵文件和分组信息两个文件。
1)矩阵文件:文件为二维矩阵,第一行为样本名称,第一列为基因/OTU/蛋白id等名称。
注意:输入的矩阵列数不超过100,若文件超过5Mb大小则需要在“我的数据”版块中上传本地数据,之后在工具页面选择“我的数据”进行分析。
2)分组文件:两列数据格式,第一列为散点/变量名称,需和输入文件的名称完全一致,第二列为分组信息,必须含表头(列名)。

4. 参数说明
是否归一化:利用z-score进行数据归一化,将每个基因的表达量减去这个基因在所有样本中表达量的均值,然后除以其标准差。可消除表达量异常高低基因的影响,减少数据间的“贫富差距”。
5. 结果输出
1)任务输出:
程序根据输入的文件进行计算、绘图,这个过程等待时间与输入文件大小有关,超过10,000行的大文件需要等待1-5分钟。在页面下方结果展示中切换任务进行查看。
2)基本设置:
可对文本样式(图形标题、字体字号等)、坐标轴系(画布样式、坐标轴线等)、图例进行自定义更改。
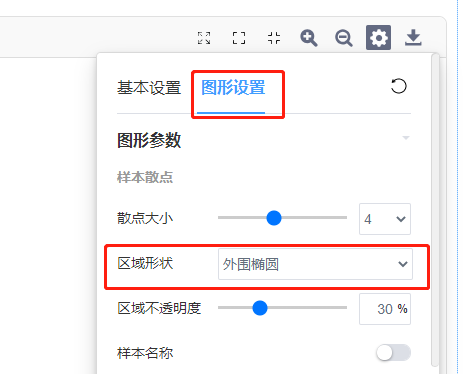
3)图形设置:
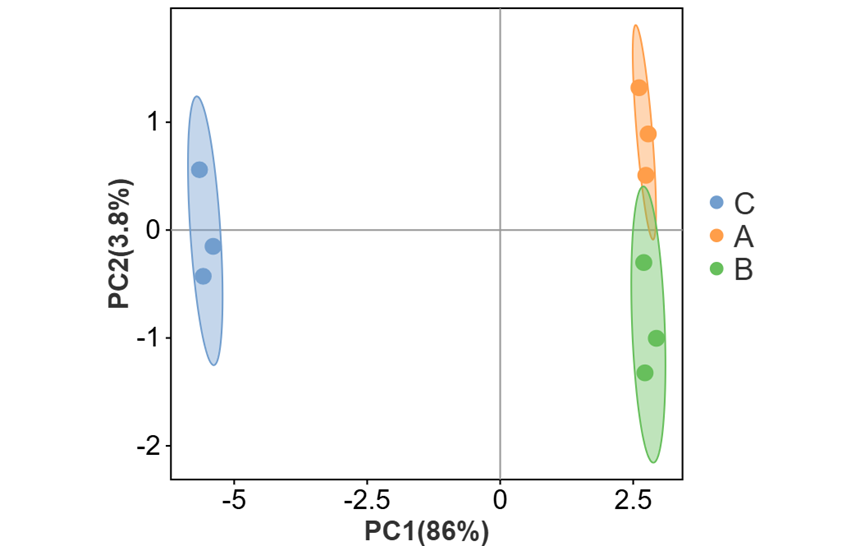
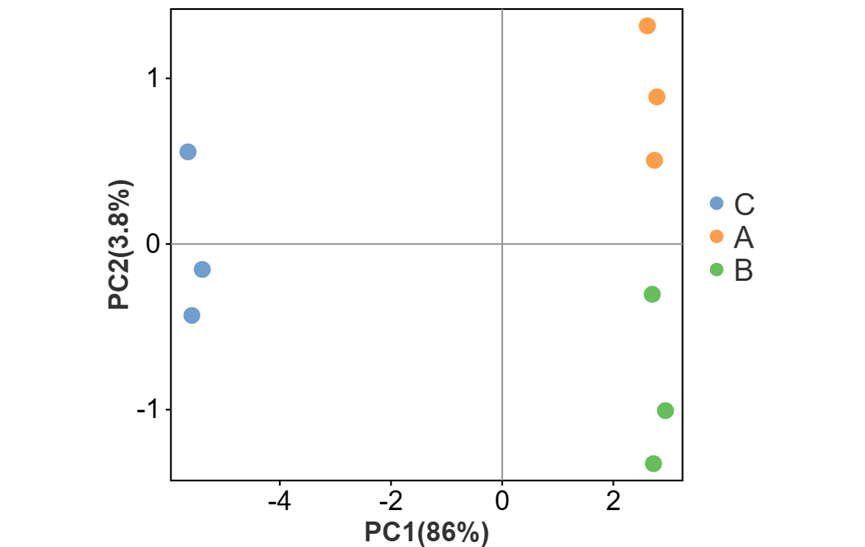
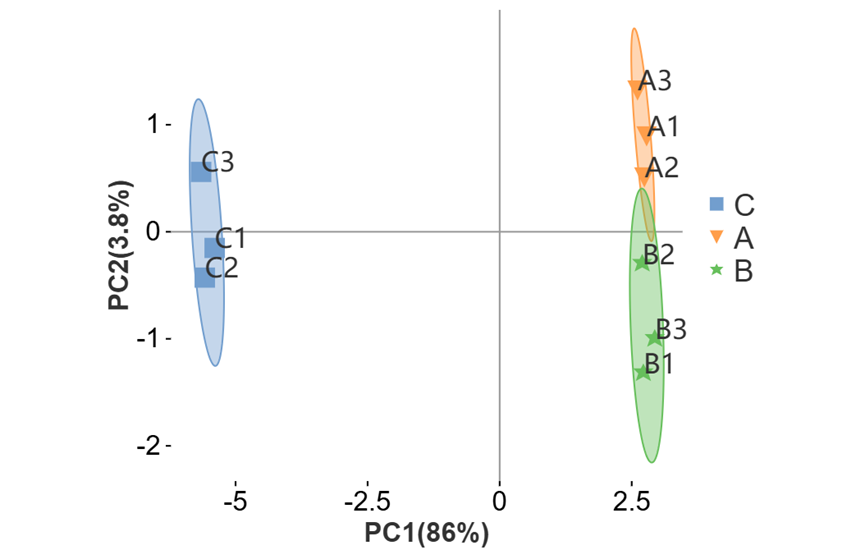
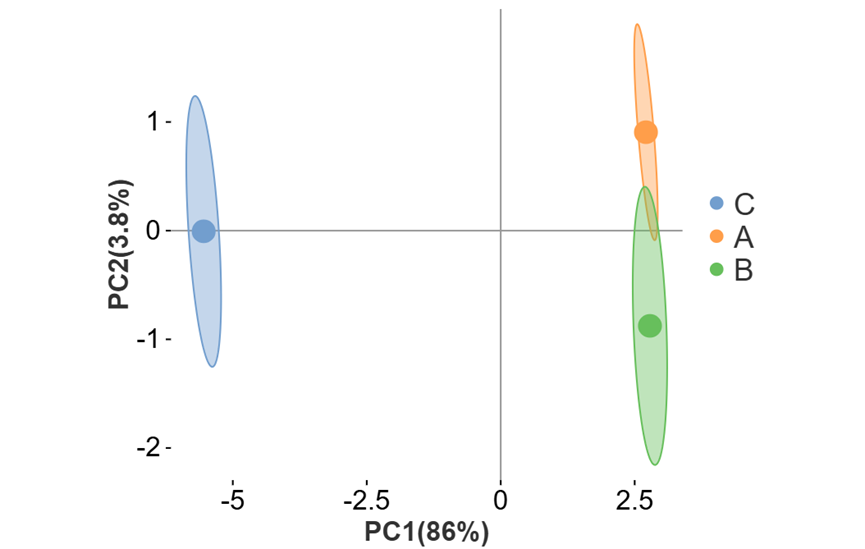
可对图形相关参数及颜色进行自定义更改。如调整散点大小、外围形状与区域透明度(有分组文件时可进行调整)、勾选展示辅助线、质心样本与质心名称等。还可以调整点的配色与形状。
其中外围形状有三种选择:
a) 不显示外围
b) 外围连线(将分组内最外围散点连接成多边形区域)
c) 外围椭圆(置信区间)
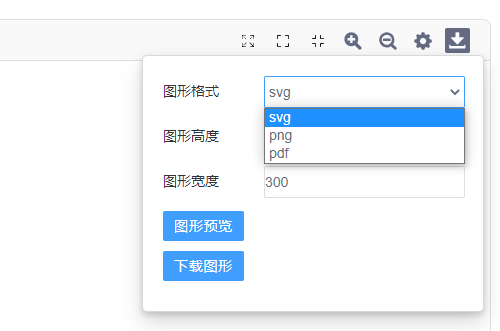
4)图片下载:
在图片尺寸修改中,可进行图形高度、宽度调整及预览;在图片下载中,提供svg、pdf、png、jpeg、bmp、tiff矢量及位图格式可供下载。
6. 图表效果参考
*通过调整不同的参数组合,可绘制多种效果韦恩图,部分样式参考如下:
1)网格线关,区域形状—不显示外围
2)网格线关,区域形状—外围连线
3)网格线关,区域形状—外围椭圆
4)坐标轴粗细0,网格线关,区域形状—外围椭圆,显示样本名称,散点形状更改
5)坐标轴粗细0,网格线关,区域形状—外围椭圆,显示质心
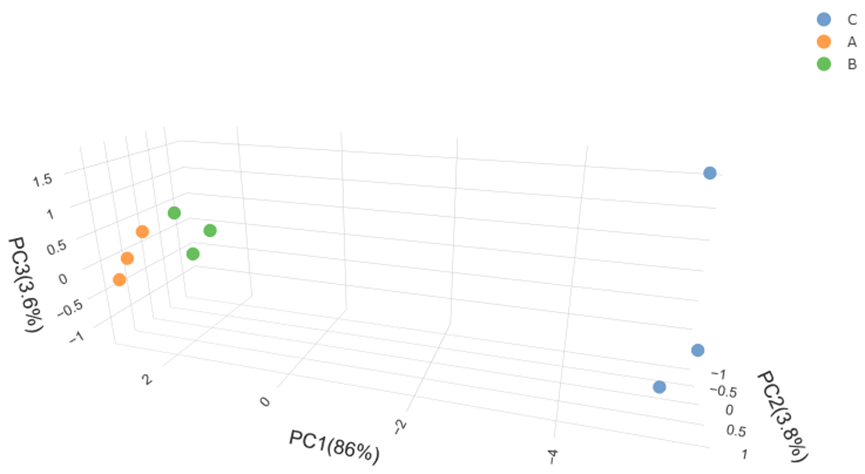
6)参数维度—3D
Q1. 如下图,为什么动态PCA图例多了一点?
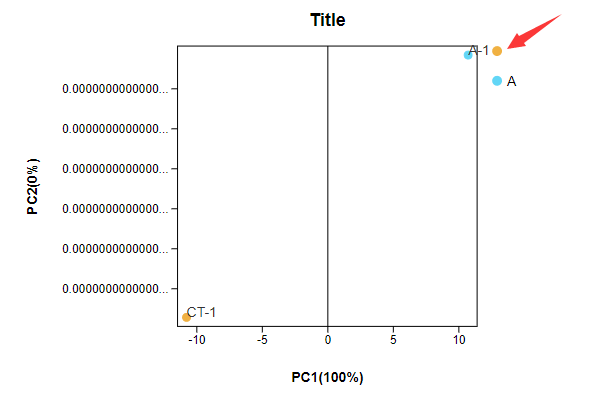
分组表格需要带有行名(如sample、group等),请检查分组表格!
Q1. 提交时报错常见问题:
1.提交时显示X行X列空行/无数据,请先自查表格中是否存在空格或空行,需要删掉。
2.提交时显示列数只有1列,但表格数据不止1列:列间需要用分隔符隔开,先行检查文件是否用了分隔符。
Q2. 任务出错?
PCA常见出错是分组信息中的样本名与矩阵表格不匹配。
Q3. 如何添加置信椭圆?
只有动态PCA可以添加置信椭圆,且必须上传分组文件。
具体步骤:跳转查看——设置——图形参数——区域形状——外围椭圆/外围连线。
Q4.PCA/三维PCA的行列文件必须输入吗?
不是。筛选行/列名是可选输入。您可以筛选矩阵表格中的行/列数据进行绘图。若不填,默认全部数据绘图。
Q5.图片模糊怎么办?
动态PCA提供png、pdf、svg格式图片下载。pdf及svg均为矢量图,可无限放大不模糊。
在动态界面,即可下载。
引用OmicShare Tools的参考文献为:
Mu, Hongyan, Jianzhou Chen, Wenjie Huang, Gui Huang, Meiying Deng, Shimiao Hong, Peng Ai, Chuan Gao, and Huangkai Zhou. 2024. “OmicShare tools: a Zero‐Code Interactive Online Platform for Biological Data Analysis and Visualization.” iMeta e228. https://doi.org/10.1002/imt2.228案例1:
发表期刊:Horticulturae
影响因子:3.1
发表时间:2022
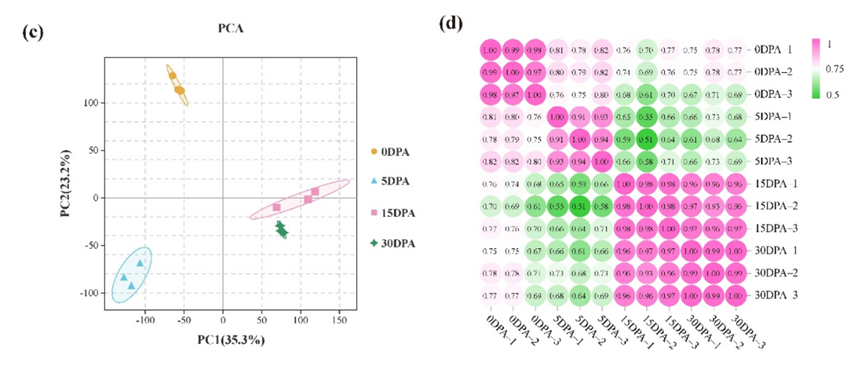
Figure 1. Tomato pedicels, AZ size, and transcriptome analysis between different development stages. (c) Principal component analysis of the transcriptome samples. (d) Correlation analysis between the twelve samples.
引用方式:This analysis was performed using the OmicShare tool, a free online platform for data analysis (https://www.omicshare.com/tools, accessed on 8 June 2022).
参考文献:
Dong X, Wang Y, Yan Y, et al. Transcriptome Analysis of the Development of Pedicel Abscission Zone in Tomato[J]. Horticulturae, 2022, 8(10): 865.
案例2:
发表期刊:Food Research International
影响因子:8.1
发表时间:2022
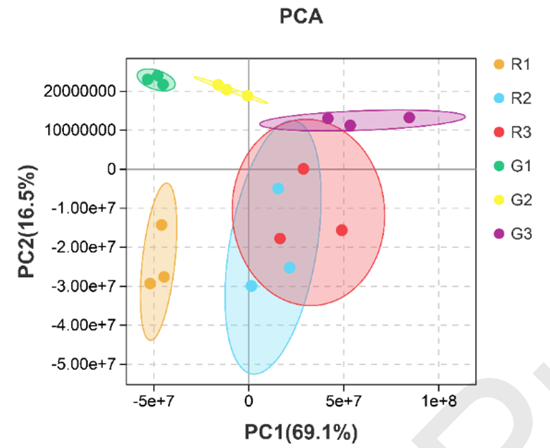
Fig. 1. Amino acid metabolism profile of green and red pepper fruits. (a) PCA analysis of amino acids in different samples.
引用方式:The relative levels of 78 amino acids and their derivatives detected in green and red pepper fruits and the expression levels of differentially expressed genes in the transcriptome were analyzed using the Omicshare data processing platform developed by GENE DENOVO (https://www.omicshare.com) for principal component analysis (PCA) analysis. The parameters were set by default.
参考文献:
Fei X, Hu H, Luo Y, et al. Widely targeted metabolomic profiling combined with transcriptome analysis provides new insights into amino acid biosynthesis in green and red pepper fruits[J]. Food Research International, 2022, 160: 111718.
案例3:
发表期刊:LWT
影响因子:6.0
发表时间:2023
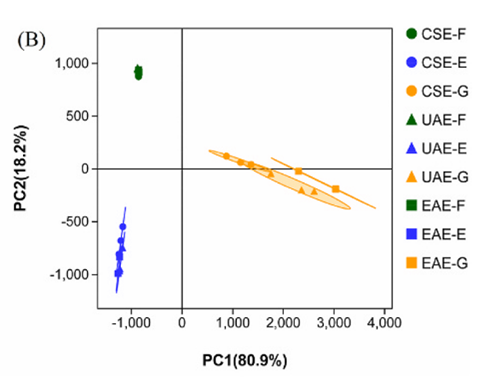
Fig. 2. Effects of conventional solvent extraction (CSE), ultrasound-assisted extraction (UAE), and enzymeassisted extraction (EAE) on the phenolic sub-classes (A) and principal component analysis (PCA) model (B) of the extracts from brocade orange peels. Each bar represents the mean of three replicates ±standard error.
引用方式:Principal component (PC) analysis (PCA) and correlation assay were applied to data set to draw chemical differences of phenolic compounds with the help of OmicShare tools, a free online platform for data analysis (http://www.omicshare.com/tools).
参考文献:
Wang Z, Mei X, Chen X, et al. Extraction and recovery of bioactive soluble phenolic compounds from brocade orange (Citrus sinensis) peels: Effect of different extraction methods thereon[J]. LWT, 2023, 173: 114337.
案例4:
发表期刊:Animals
影响因子:3.0
发表时间:2022
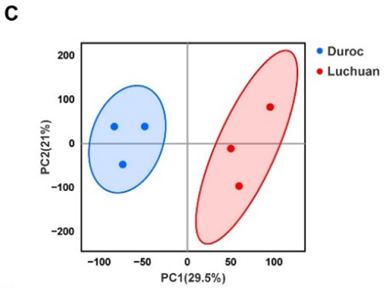
Figure 1. Phenotype and characteristics of RNA-seq data. (C) PCA of samples.
引用方式:
Gene expression level was measured by Fragments per Kilobase per Million Mapped Fragments (FPKM) [17], the most commonly used method for estimating gene expression abundance. DEGSeq [18] was used to analyze DEGs (|Fold Change| > 2 and p-value < 0.01).The Principal Component Analysis (PCA), Gene Ontology (GO) term enrichment analysis, Kyoto Encyclopedia of Genes and Genomes (KEGG) pathway enrichment analysis and GSEA were performed using Omicshare, a real-time interactive online data analysis platform (p-value < 0.05) (http://www.omicshare.com (accessed on 18 February 2022)) [19].
参考文献:
Pan H, Huang T, Yu L, et al. Transcriptome Analysis of the Adipose Tissue of Luchuan and Duroc Pigs[J]. Animals, 2022, 12(17): 2258.
案例5
发表期刊:Horticulture Research
影响因子:8.7
发表时间:2022
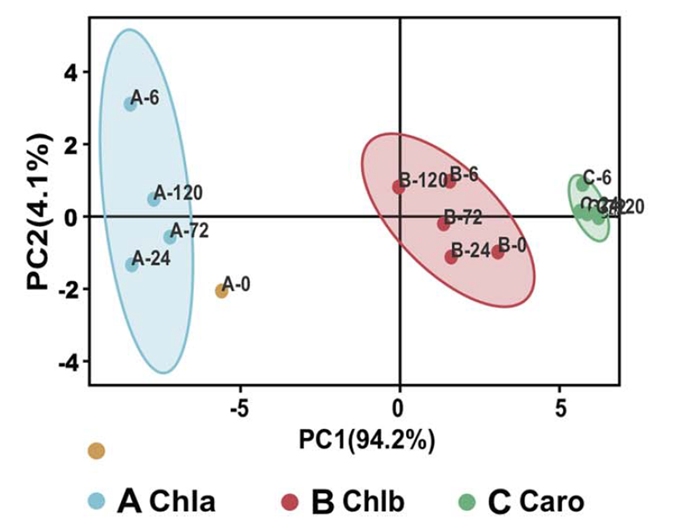
Figure1 b Chlorophyll a (Chla), chlorophyll b (Chlb) and carotenoid (Caro) contents in the first leaf of homo- and heterografted seedlings after different periods of chilling stress. Three replicates of the pooled first true leaves and 9 or 10 individual seedlings per replicate at each time point were used for the analysis, and results from PCA of these data (bottom right). Error bars represent the standard deviation.
引用方式:
PCA for physiological parameters, including chlorophyll a, chlorophyll b, and carotenoid contents, was performed for samples of each graft combination from each chilling treatment time point, using the PCA online tool (Omicshare, http://www.omicshare.com/tools/home/report/reportpca.html).
参考文献:
Liu W, Wang Q, Zhang R, et al. Rootstock–scion exchanging mRNAs participate in the pathways of amino acid and fatty acid metabolism in cucumber under early chilling stress[J]. Horticulture Research, 2022, 9: uhac031.
案例6
发表期刊:Journal of Hazardous Materials
影响因子:13.6
发表时间:2022
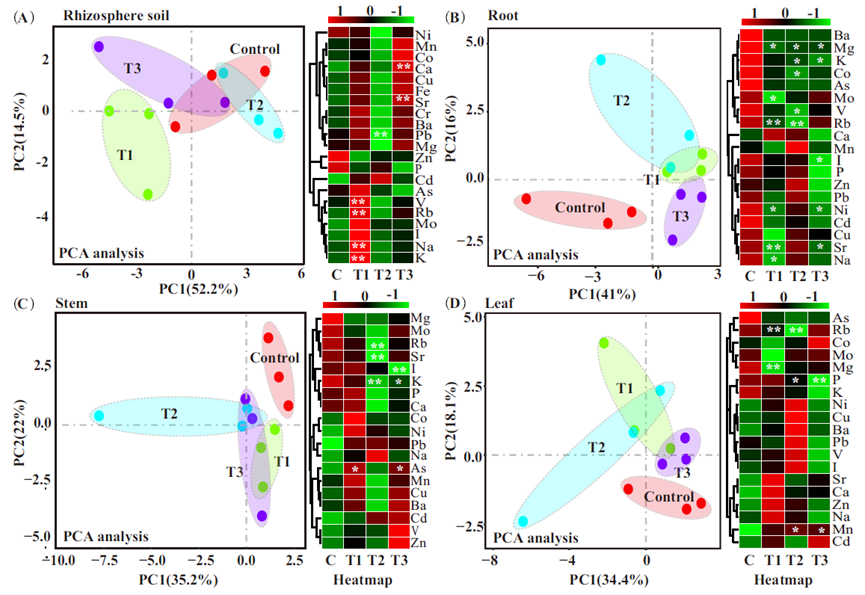
引用方式:
Graphic layouts were generated using Adobe Illustrator CS6 (Adobe Systems Incorporated,
USA). The online analysis platform (Omicshare, https://www.omicshare.com/tools/) was used to draw the statistical charts (heatmap,PCA, and Venn diagrams) used in this study.
参考文献:
Fu Q, Lai J, Ji X, et al. Alterations of the rhizosphere soil microbial community composition and metabolite profiles of Zea mays by polyethylene-particles of different molecular weights[J]. Journal of Hazardous Materials, 2022, 423: 127062.