


 扫码支付更轻松

功能介绍:
KEGG(Kyoto Encyclopedia of Genes and Genomes)数据库是系统地分析基因功能、链接基因组信息和功能信息的数据库,包括代谢通路(pathway)数据库、分层分类数据库、基因数据库、基因组数据库等。KEGG的pathway数据库是应用最广泛的代谢通路公共数据库,是系统分析基因产物在细胞中的代谢途径以及这些基因产物的功能的数据库,利用 KEGG 可以进一步研究基因在生物学上的复杂行为。根据 KEGG 注释信息我们能得到 Unigene的 Pathway 注释。
输入文件
1.选择文件
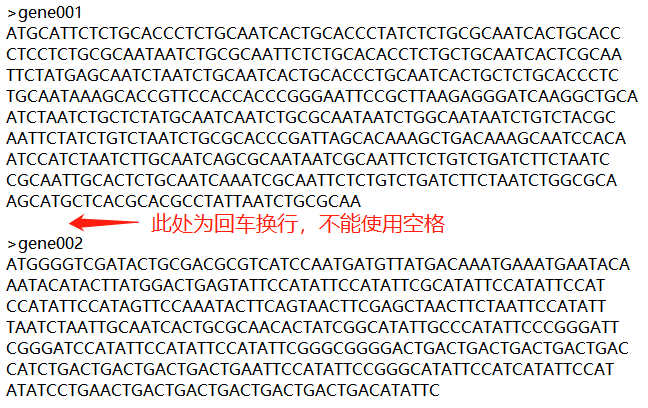
输入fasta格式的核酸或蛋白query序列或上传fasta格式的query序列文件。
每个序列前需带有“>序列名”,且序列名不能带有特殊字符及空格;序列间需要回车“Enter”间隔一行,不能带有空格。
示例:
2. 选择物种
选择对应的KEGG数据库的数据集
输出结果
(具体图例、统计表包含信息请见“例子”栏)
1注释结果
表1 KEGG注释结果信息统计表(all.kegg.xls)
2.注释结果统计
1)注释结果数目统计
将注释上的与注释不上的序列数目进行统计并画饼图。
表2 注释结果数目统计表( kegg_stat.xls)
图1 注释结果数目统计饼图(kegg_stat.png/pdf)
2)E值分布统计
E值是指期望数据库中具有某一统计学意义配对序列的值,可理解为比对的假阳性率。E值越小,结果越可靠。对E值分为5个范围进行统计,并画饼图。
表3 E值分布统计表(kegg.evalue_stat.xls)
图2 E值分布统计饼图(kegg.evalue_stat.png/pdf)
3. KEGG注释统计
表4 Pathway注释信息统计表(all.path.xls)
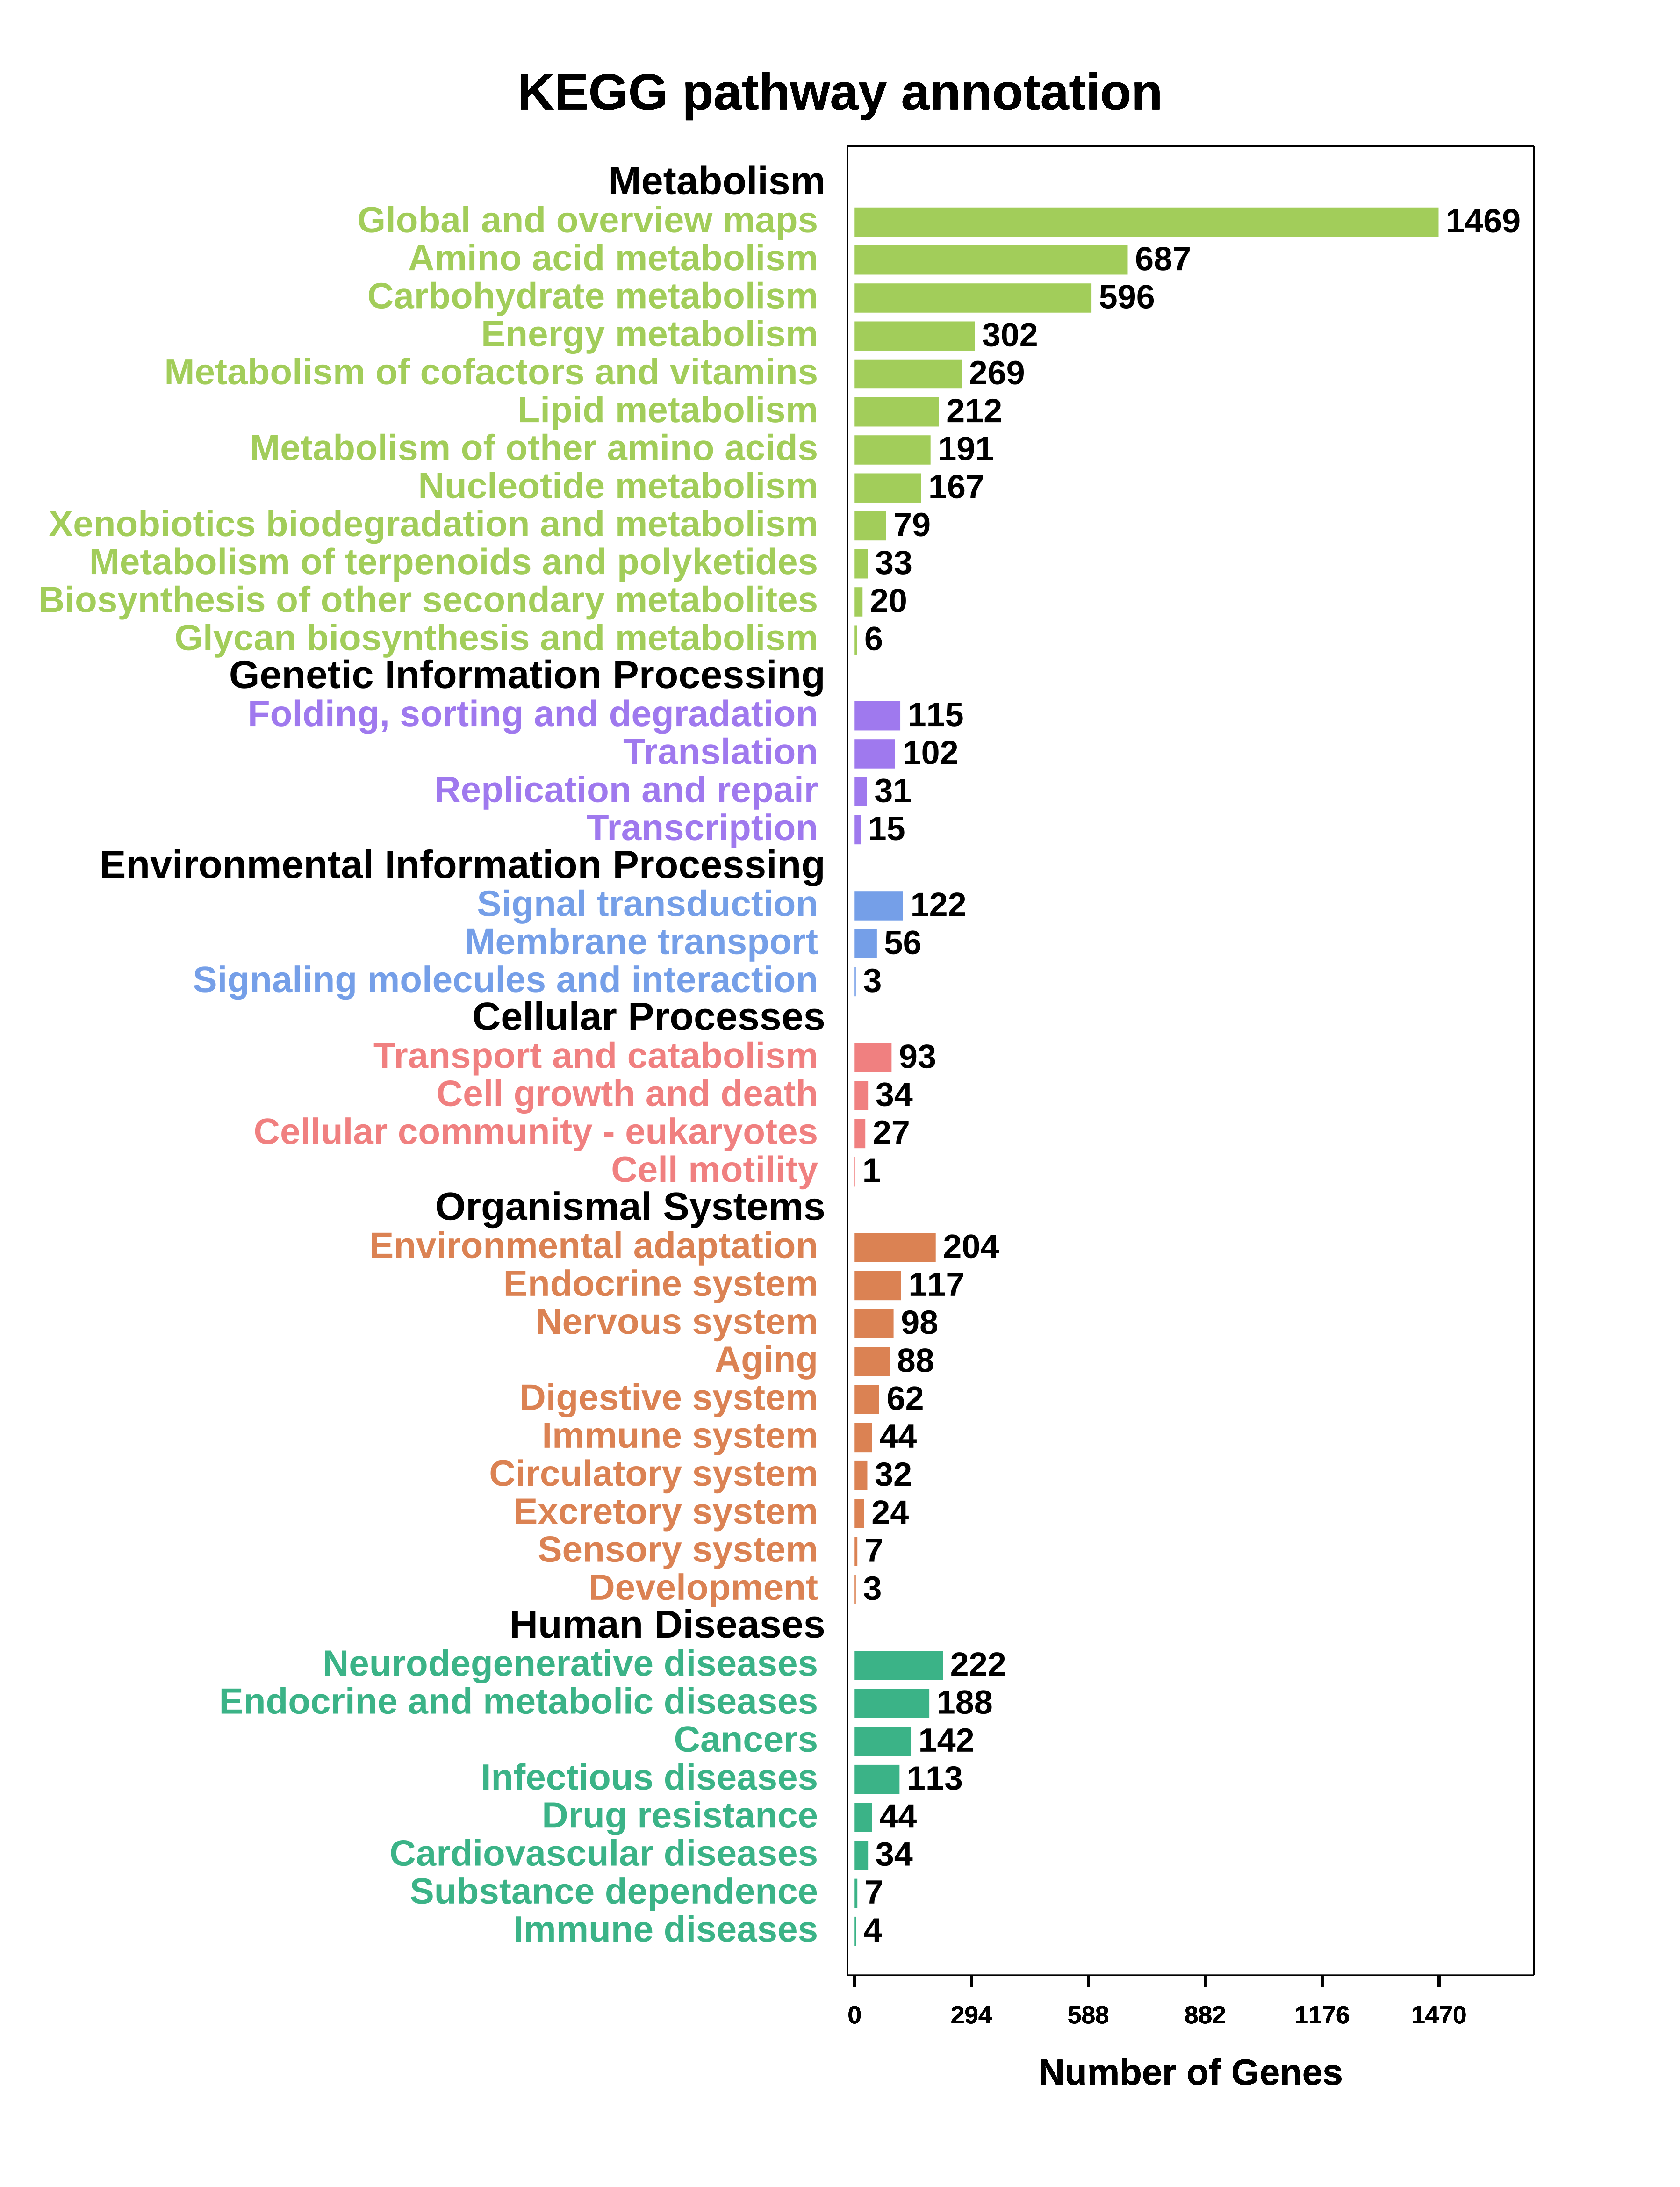
图3 KO富集条形图 (all.path.xls.png/svg)
输出结果说明
注释结果信息统计表
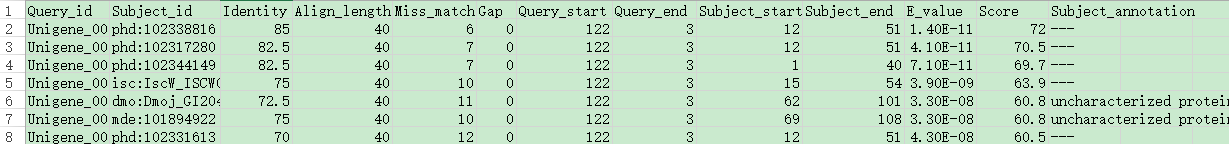
表头解释
Query_id Unigene序列的ID号
Subject_id 比对到KEGG数据库中序列名
Identity(%) 比对的相似性(百分比)
Align_length 比对上的长度
Mis_match 比对的错配数
Gap Gap 的数目
Query_start 比对上的部分在 query序列上的起始位置
Query_end 比对上的部分在query序列上的终止位置
Subject_start 比对上的部分在 COG 序列上的起始位置
Subject_end 比对上的部分在 COG 序列上的终止位置
E_value 比对的 E值(E值越小,可信度越高)
Score 比对的打分(打分越高,可信度越高)
E_value 比对的 E值(E值越小,可信度越高)
Score 比对的打分(打分越高,可信度越高)
Subject_annotation KEGG序列的描述
2. 注释结果数目统计
注释结果数目统计表表头解释
Total :输入的所有序列数
Annotation :注释上的序列数
without_annotation :没有注释上的序列数
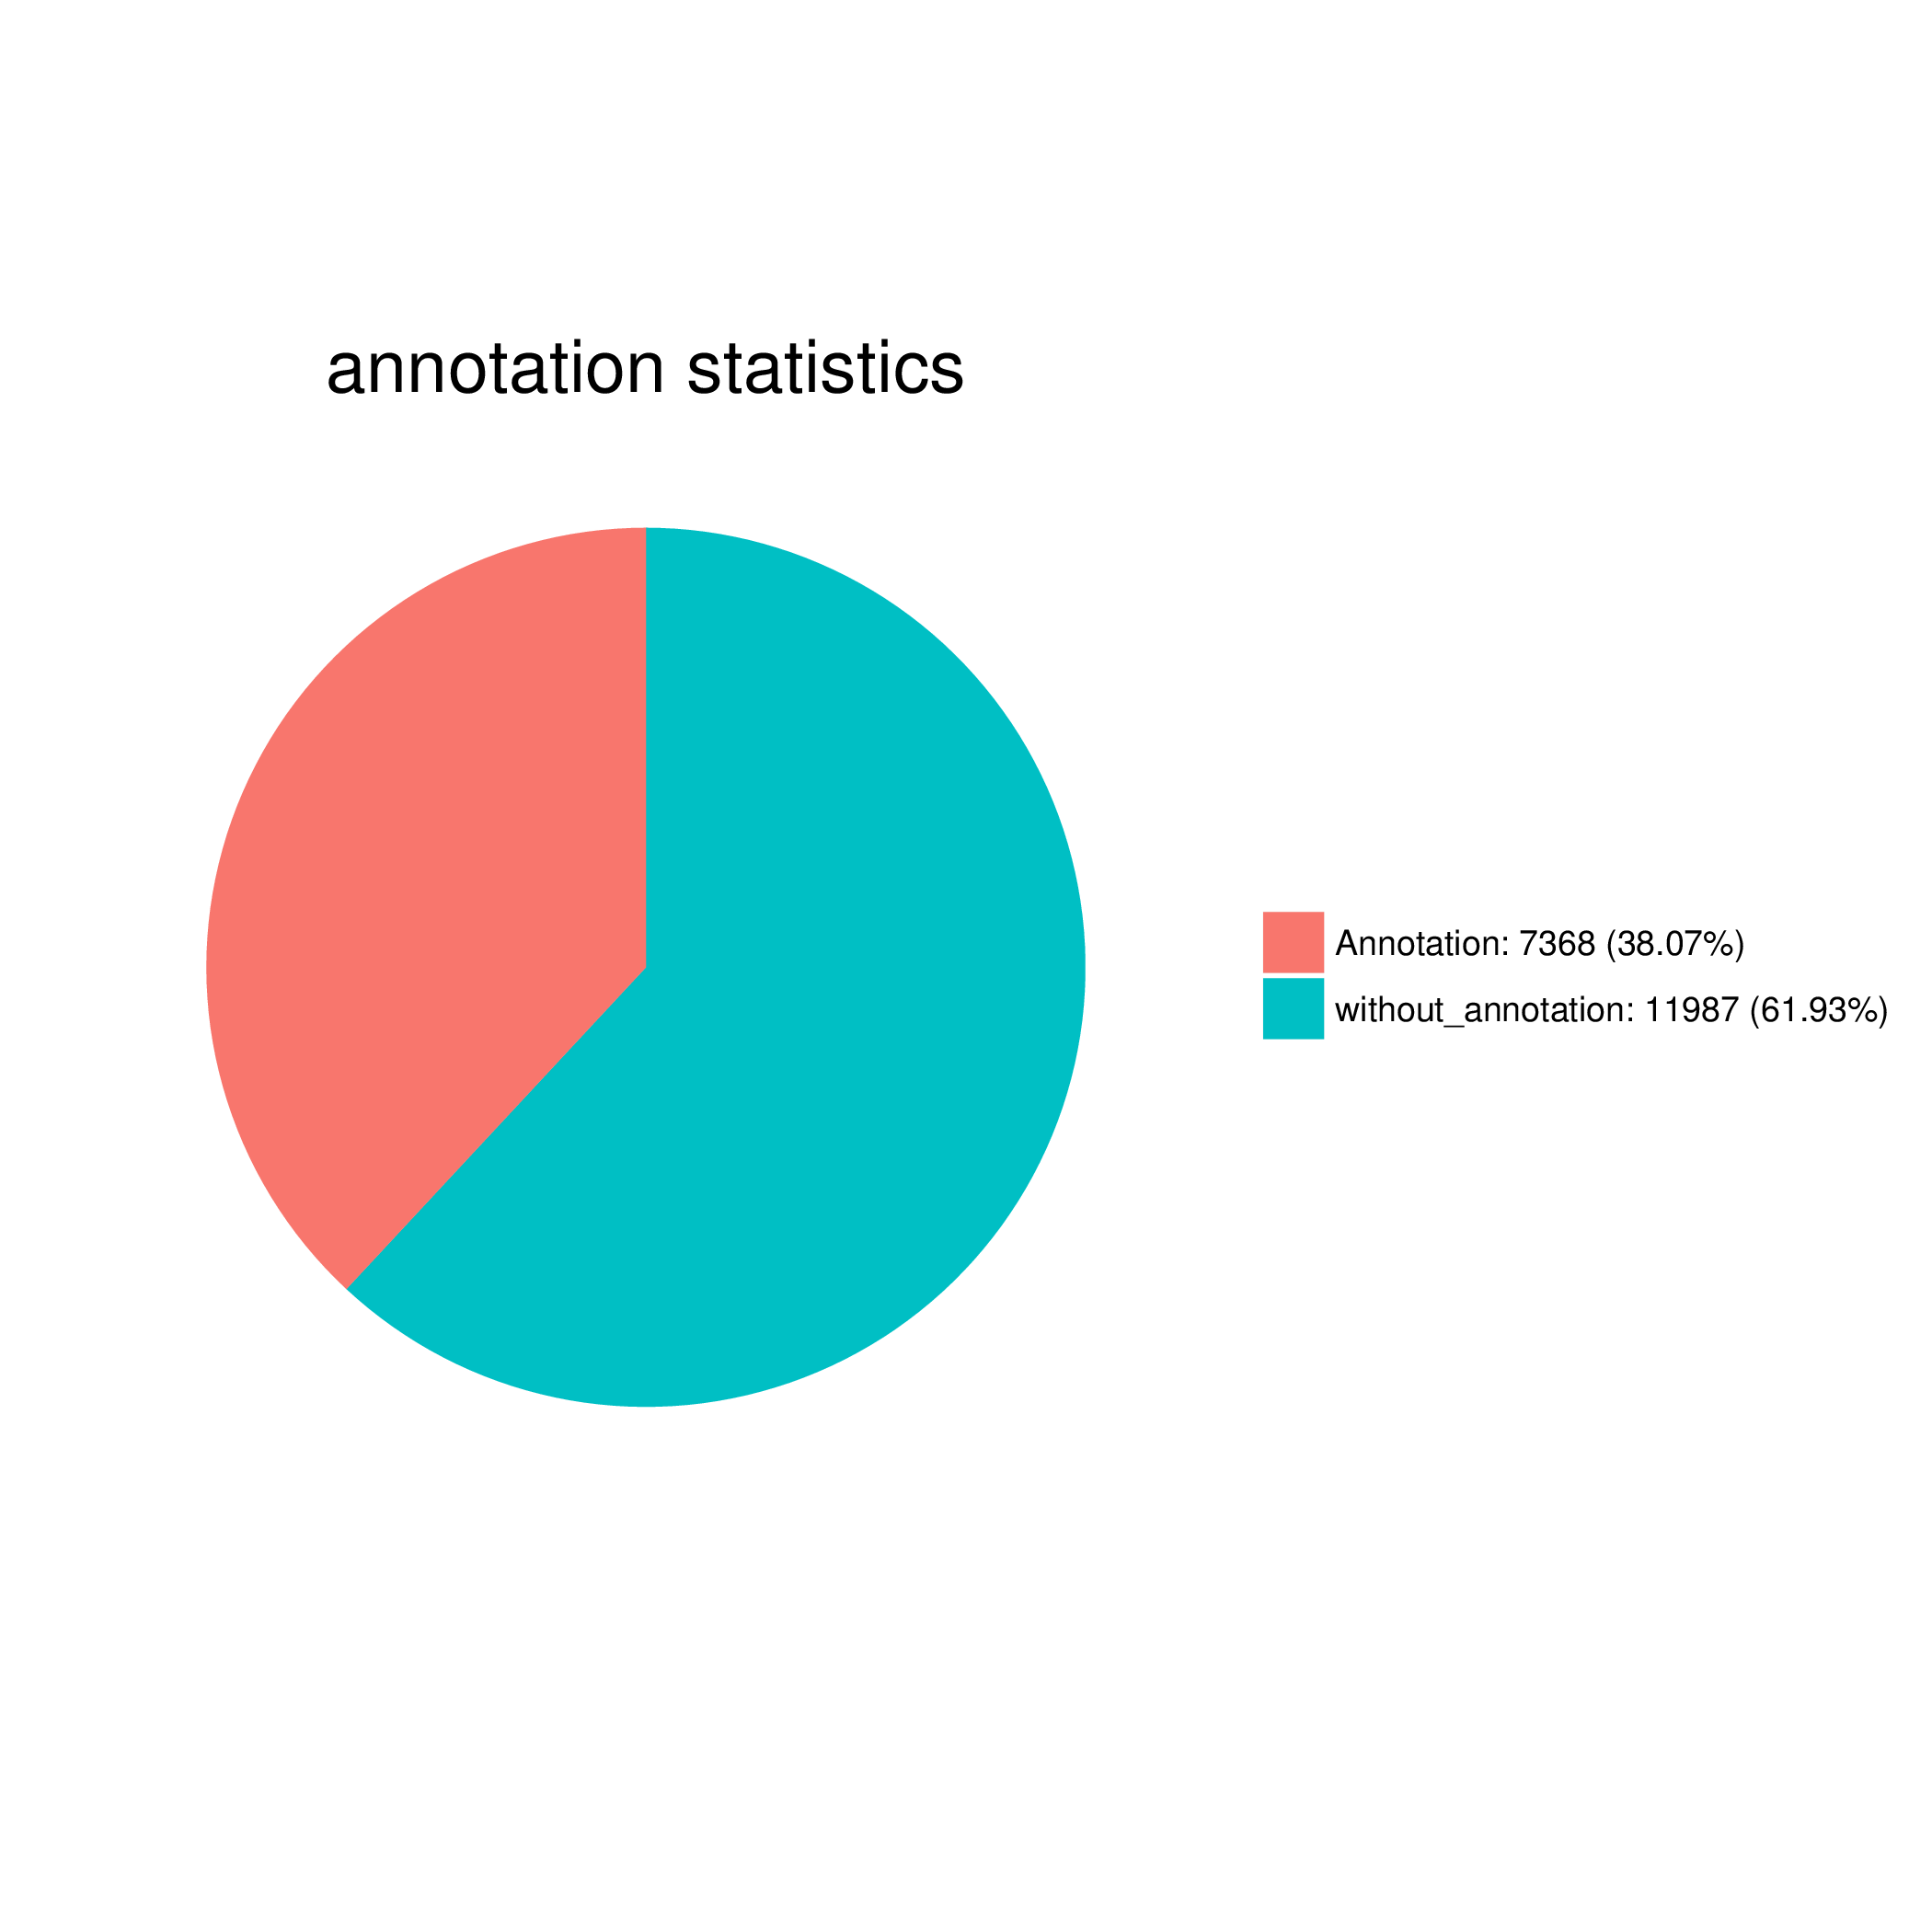
图1 注释结果数目统计饼图
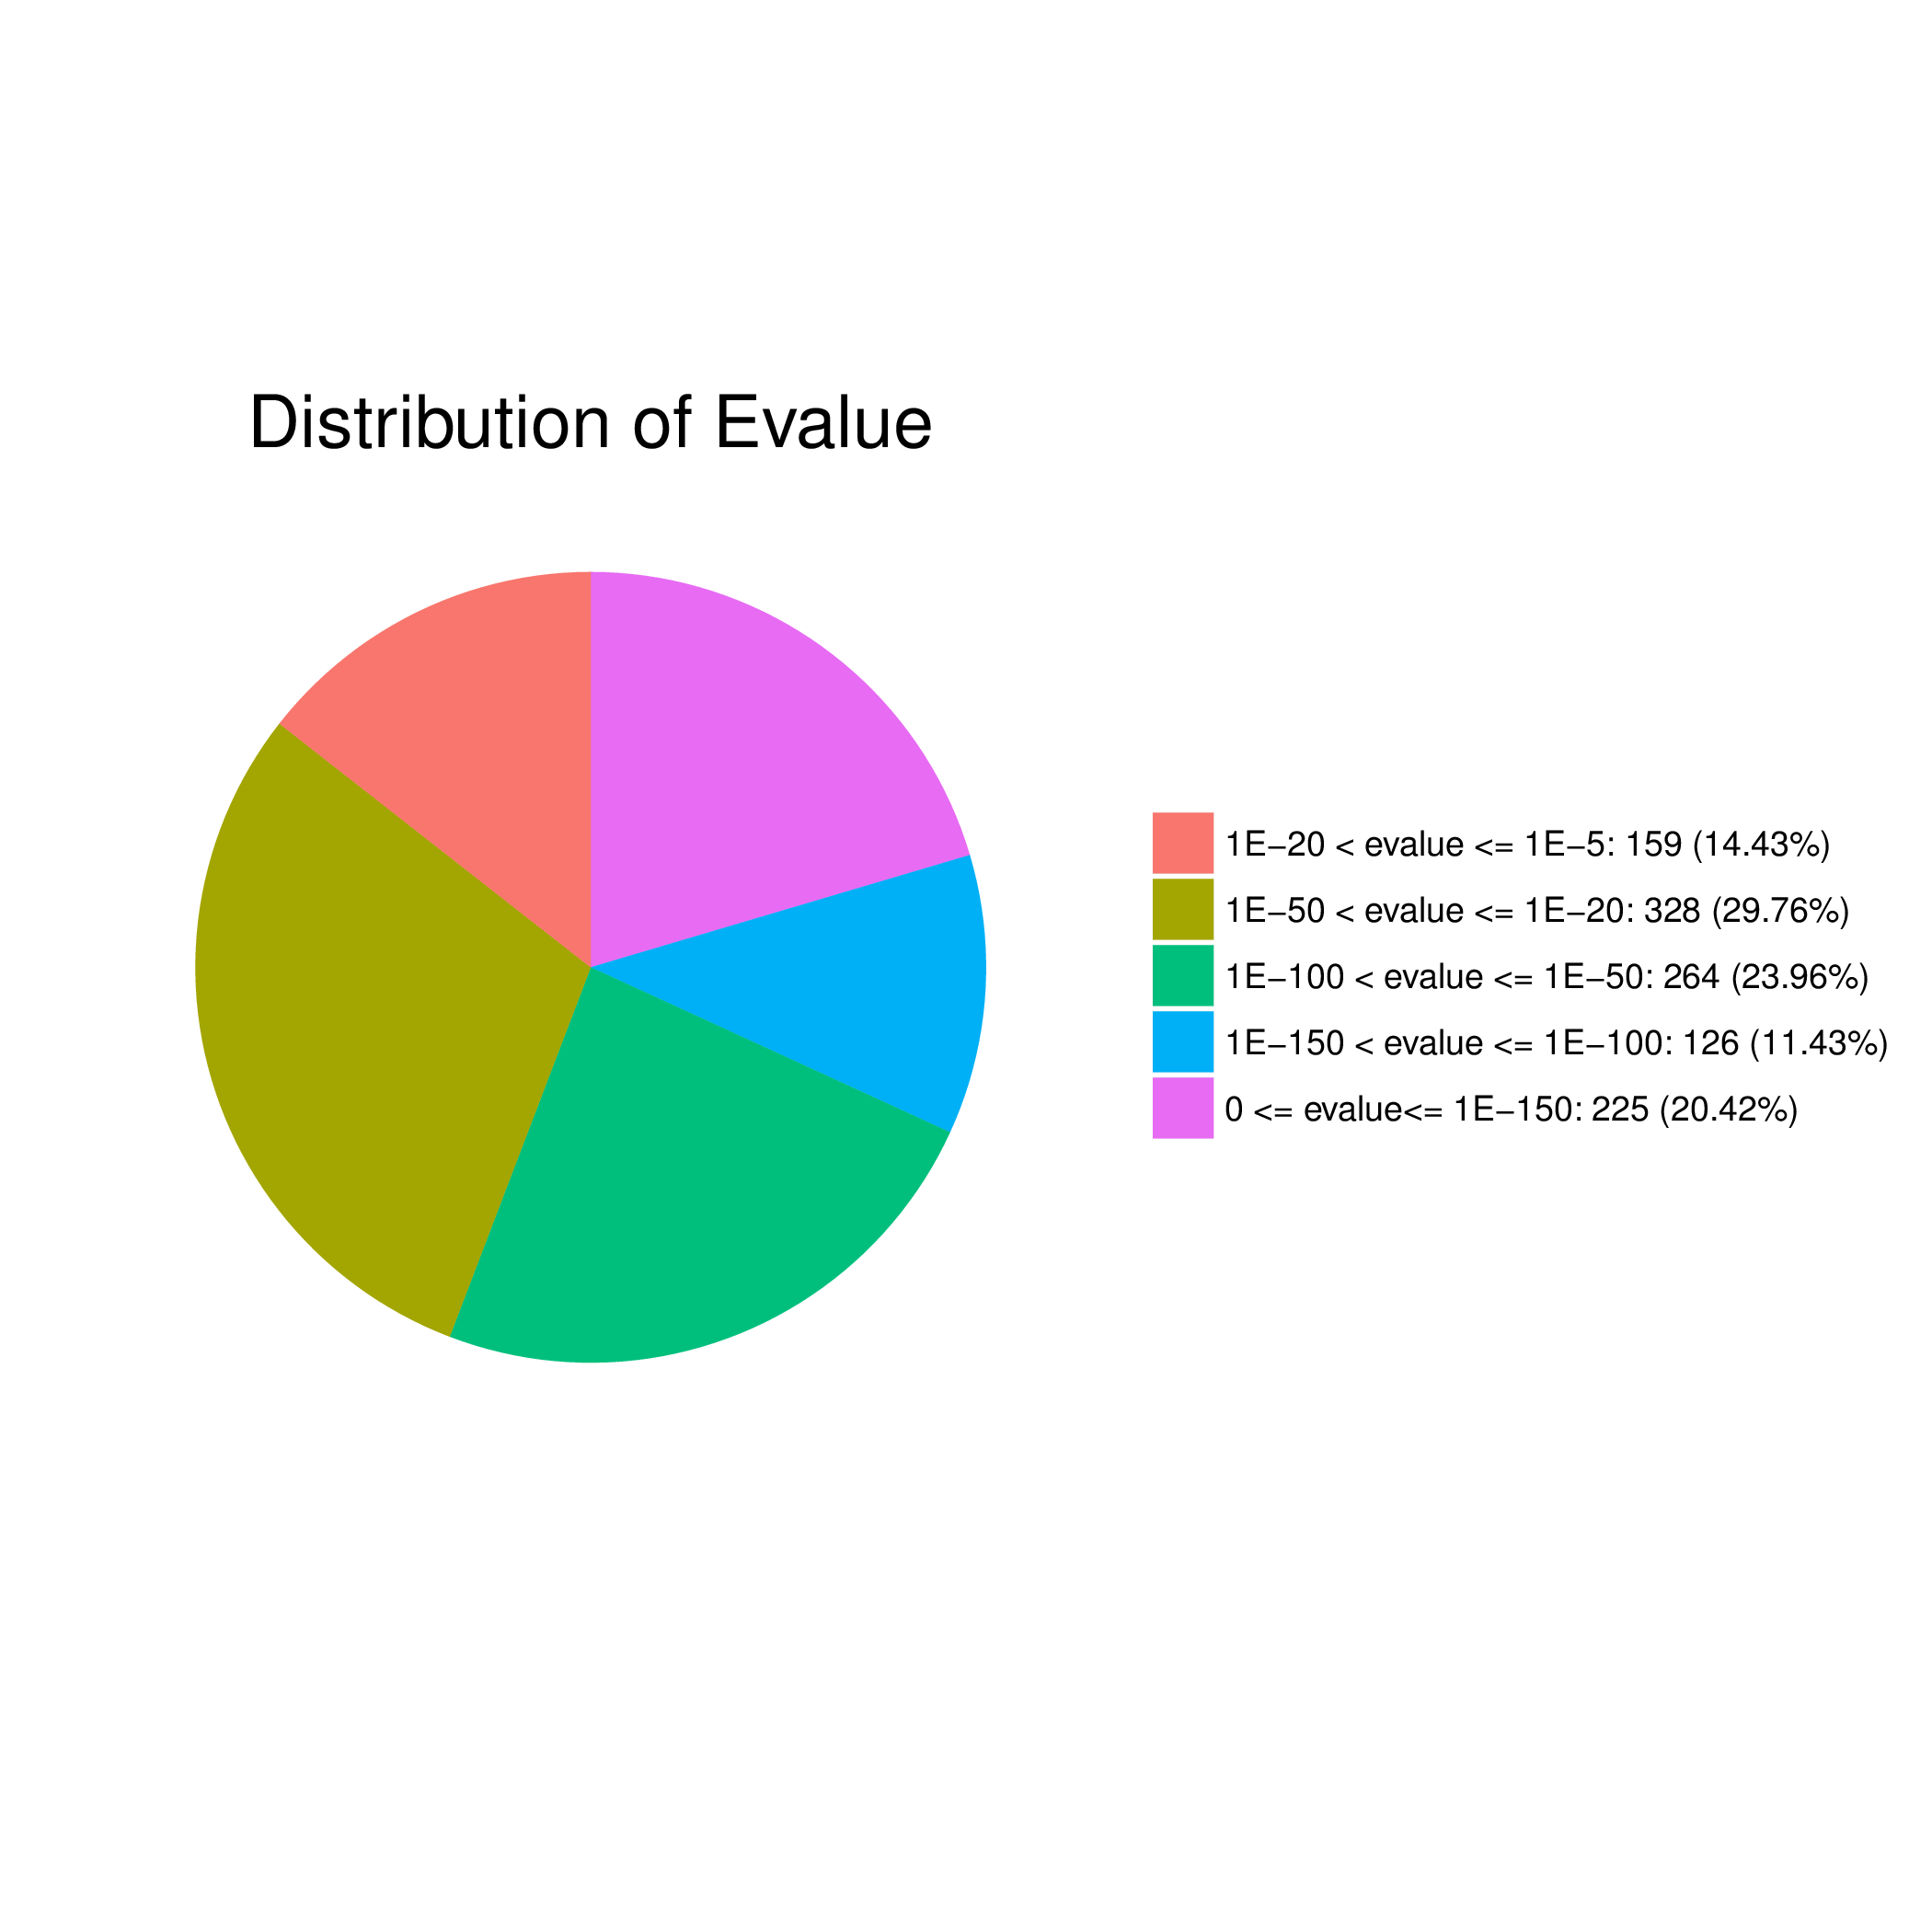
图2 E值分布统计饼图
3. KEGG注释统计
Pathway注释信息统计表
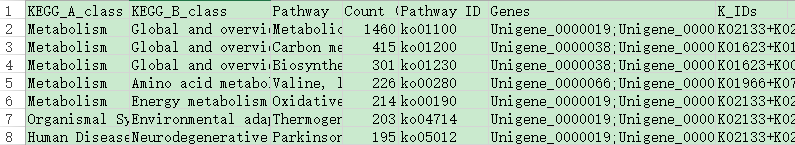
表头说明
Pathway 通路名
Pathway ID KEGG 数据库中的 Pathway ID
Number of Gene 注释到该通路的基因的数目
Gene ID 注释到该 Pathway 的基因
KO ID 属于该 Pathway 的 KEGG Orthology
Q1. 上传的数据需要保存成什么格式?文件名称和拓展名有没有要求?
OmicShare当前支持txt(制表符分隔)文本文件、csv(逗号分隔)文本文件、以及Excel专用的xlsx格式,同样支持旧版Excel的xls(Excel 97-2003 )格式。如果是核酸、蛋白序列文件,必须为FASTA格式(本质是文本文件)。
文件名可由英文和数字构成,文件拓展名没有限制,可以是“.txt”、“.xlsx”、“.xls”、“.csv”“.fasta”等,例如 mydata01.txt,gene02.xlsx 。
Q2.注释工具的任务一般要跑多久?
注释工具的任务时长一般与提交的序列条数成正比,且不同工具耗时也差异很大。例如GO功能注释近一年来所有任务平均时长约为2天,而NR注释工具近一年来所有任务平均时长约为3小时。一般情况下,如果任务耗时超出一周可联系OS客服,发送任务编号给OmicShare客服,会有专人为你处理任务问题。