


 扫码支付更轻松

1. 功能
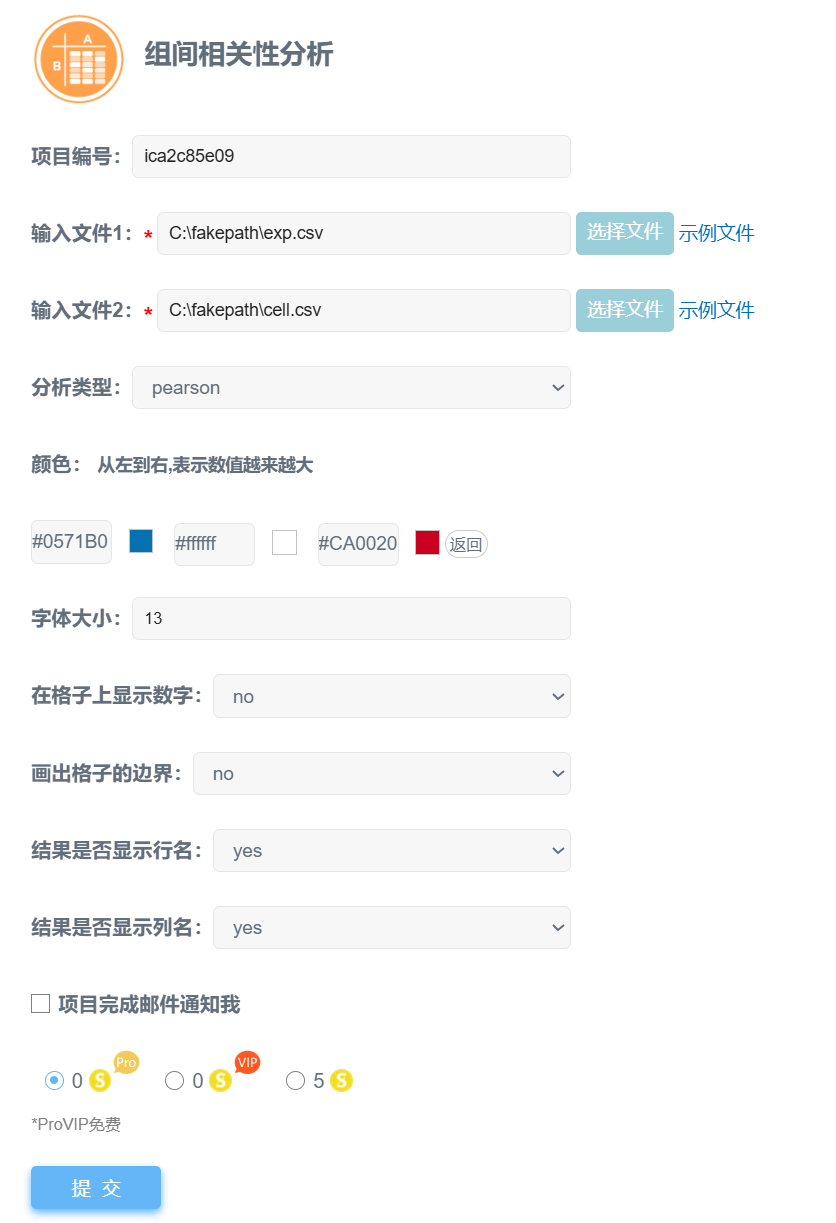
计算两个表格之间所有元素的两两相关性,并绘制相关性热图。

2. 输入
1)两个表格可以为两个组学数据,例如基因表达量表、代谢物丰度表、微生物丰度表等;也可以是表型数据,例如升高体重等生理指标。
2)表格需要带表头和列名,每一列代表样本,行代表各种元素,例如OUT、基因、cell type等。
3)输入文件支持txt(制表符分隔)文本文件、csv(逗号分隔)文本文件、以及Excel专用的xlsx格式,同样支持旧版Excel的xls(Excel 97-2003 )格式。
备注:该工具计算两个表格间每行数据的相关性。
文件1eg:

文件2eg:

3. 参数
1)分析类型:包含两种,pearson和spearman; pearson系数,通常用于计算连续数据的相关性,spearman系数,专门用于计算等级数据的相关性
2)颜色:可根据数据量大小、相关性系数波动范围等选择2种或3种渐变色,支持自定义
3)字体大小:默认为10
4)在格子上显示数字:默认为no,不显示
5)画出格子边界:默认为no,不显示
6)结果是否显示行名:默认为yes,显示
7)结果是否显示列名:默认为yes,显示
4. 输出
输出相关性计算结果表及相关性热图,具体如下:
1)all.cor.matrix.xls:相关系数矩阵,绘制热图的数据格式
2)all.pvalue.matrix.xls:相关显著性p值矩阵
3)all.cor_pvalue.list.xls:相关系数及p值列表,云平台工具绘制网络图的数据格式(网络图链接 )
4)all.cor_heatmap.png/pdf: 默认输出两种格式的相关性热图
5. 结果说明
相关系数为正表示正相关,为负表示负相关。常用的相关性强弱判断标准如下:

相关显著性p <0.05,代表显著相关;p <0.01,代表极显著相关
1. 输入数据
详见示例文件及说明页。
2. 参数
3. 输出


all.cor.matrix.xls:

all.pvalue.matrix.xls:

all.cor_pvalue.list.xls:

all.cor_heatmap.png/pdf:
Q1. 上传的数据需要保存成什么格式?文件名称和拓展名有没有要求?
OmicShare当前支持txt(制表符分隔)文本文件、csv(逗号分隔)文本文件、以及Excel专用的xlsx格式,同样支持旧版Excel的xls(Excel 97-2003 )格式。如果是核酸、蛋白序列文件,必须为FASTA格式(本质是文本文件)。
文件名可由英文和数字构成,文件拓展名没有限制,可以是“.txt”、“.xlsx”、“.xls”、“.csv”“.fasta”等,例如 mydata01.txt,gene02.xlsx 。
Q2. 提交时报错常见问题:
1.提交时显示X行X列空行/无数据,请先自查表格中是否存在空格或空行,需要删掉。
2.提交时显示列数只有1列,但表格数据不止1列:列间需要用分隔符隔开,先行检查文件是否用了分隔符。
其它提示报错,请先自行根据提示修改;如果仍然无法提交,可通过左侧导航栏的“联系客服”选项咨询OmicShare客服。
Q3. 提交的任务完成后却不出图该怎么办?
主要原因是上传的数据文件存在特殊符号所致。可参考以下建议逐一排查出错原因:
(1)数据中含中文字符,把中文改成英文;
(2) 数据中含特殊符号,例如 %、NA、+、-、()、空格、科学计数、罗马字母等,去掉特殊符号,将空值用数字“0”替换;
(3)检查数据中是否有空列、空行、重复的行、重复的列,特别是行名(一般为gene id)、列名(一般为样本名)出现重复值,如果有删掉。
排查完之后,重新上传数据、提交任务。如果仍然不出图,可通过左侧导航栏的“联系客服”选项咨询OmicShare客服。
Q4.下载的结果文件用什么软件打开?
OmicShare云平台的结果文件(例如,下图为KEGG富集分析的结果文件)包括两种类型:图片文件和文本文件。

图片文件:
为了便于用户对图片进行后期编辑,OmicShare同时提供位图(png)和矢量图(pdf、svg)两种类型的图片。对于矢量图,最常见的是pdf和svg格式,常用Ai(Adobe illustrator)等进行编辑。其中,svg格式的图片可用网页浏览器打开,也可直接在word、ppt中使用。
文本文件:
文本文件的拓展名主要有4种类型:“.os”、“.xls”、“.log”和“.txt”。这些文件本质上都是制表符分隔的文本文件,使用记事本、Notepad++、EditPlus、Excel等文本编辑器直接打开即可。结果文件中,拓展名为“.os”文件为上传的原始数据;“.xls”文件一般为分析生成的数据表格;“.log”文件为任务运行日志文件,便于检查任务出错原因。
Q5. 提交的任务一直在排队怎么办?
提交任务后都需要排队,1分钟后,点击“任务状态刷新”按钮即可。除了可能需运行数天的注释工具,一般工具数十秒即可出结果,如果超出30分钟仍无结果,请联系OS客服,发送任务编号给OmicShare客服,会有专人为你处理任务问题。
Q6. 结果页面窗口有问题,图表加载不出来怎么办?
尝试用谷歌浏览器登录OmicShare查看结果文件,部分浏览器可能不兼容。
引用OmicShare Tools的参考文献为:
Mu, Hongyan, Jianzhou Chen, Wenjie Huang, Gui Huang, Meiying Deng, Shimiao Hong, Peng Ai, Chuan Gao, and Huangkai Zhou. 2024. “OmicShare tools: a Zero‐Code Interactive Online Platform for Biological Data Analysis and Visualization.” iMeta e228. https://doi.org/10.1002/imt2.228案例1:
发表期刊:Horticulturae
影响因子:3.1
发表时间:2022
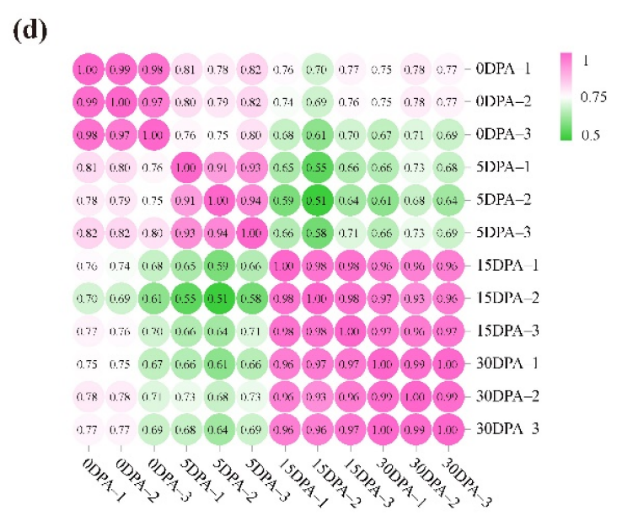
Figure 1. Tomato pedicels, AZ size, and transcriptome analysis between different development stages. (c) Principal component analysis of the transcriptome samples. (d) Correlation analysis between the twelve samples.
引用方式:This analysis was performed using the OmicShare tool, a free online platform for data analysis (https://www.omicshare.com/tools, accessed on 8 June 2022).
参考文献:
Dong X, Wang Y, Yan Y, et al. Transcriptome Analysis of the Development of Pedicel Abscission Zone in Tomato[J]. Horticulturae, 2022, 8(10): 865.
案例2:
发表期刊:LWT
影响因子:6.0
发表时间:2023
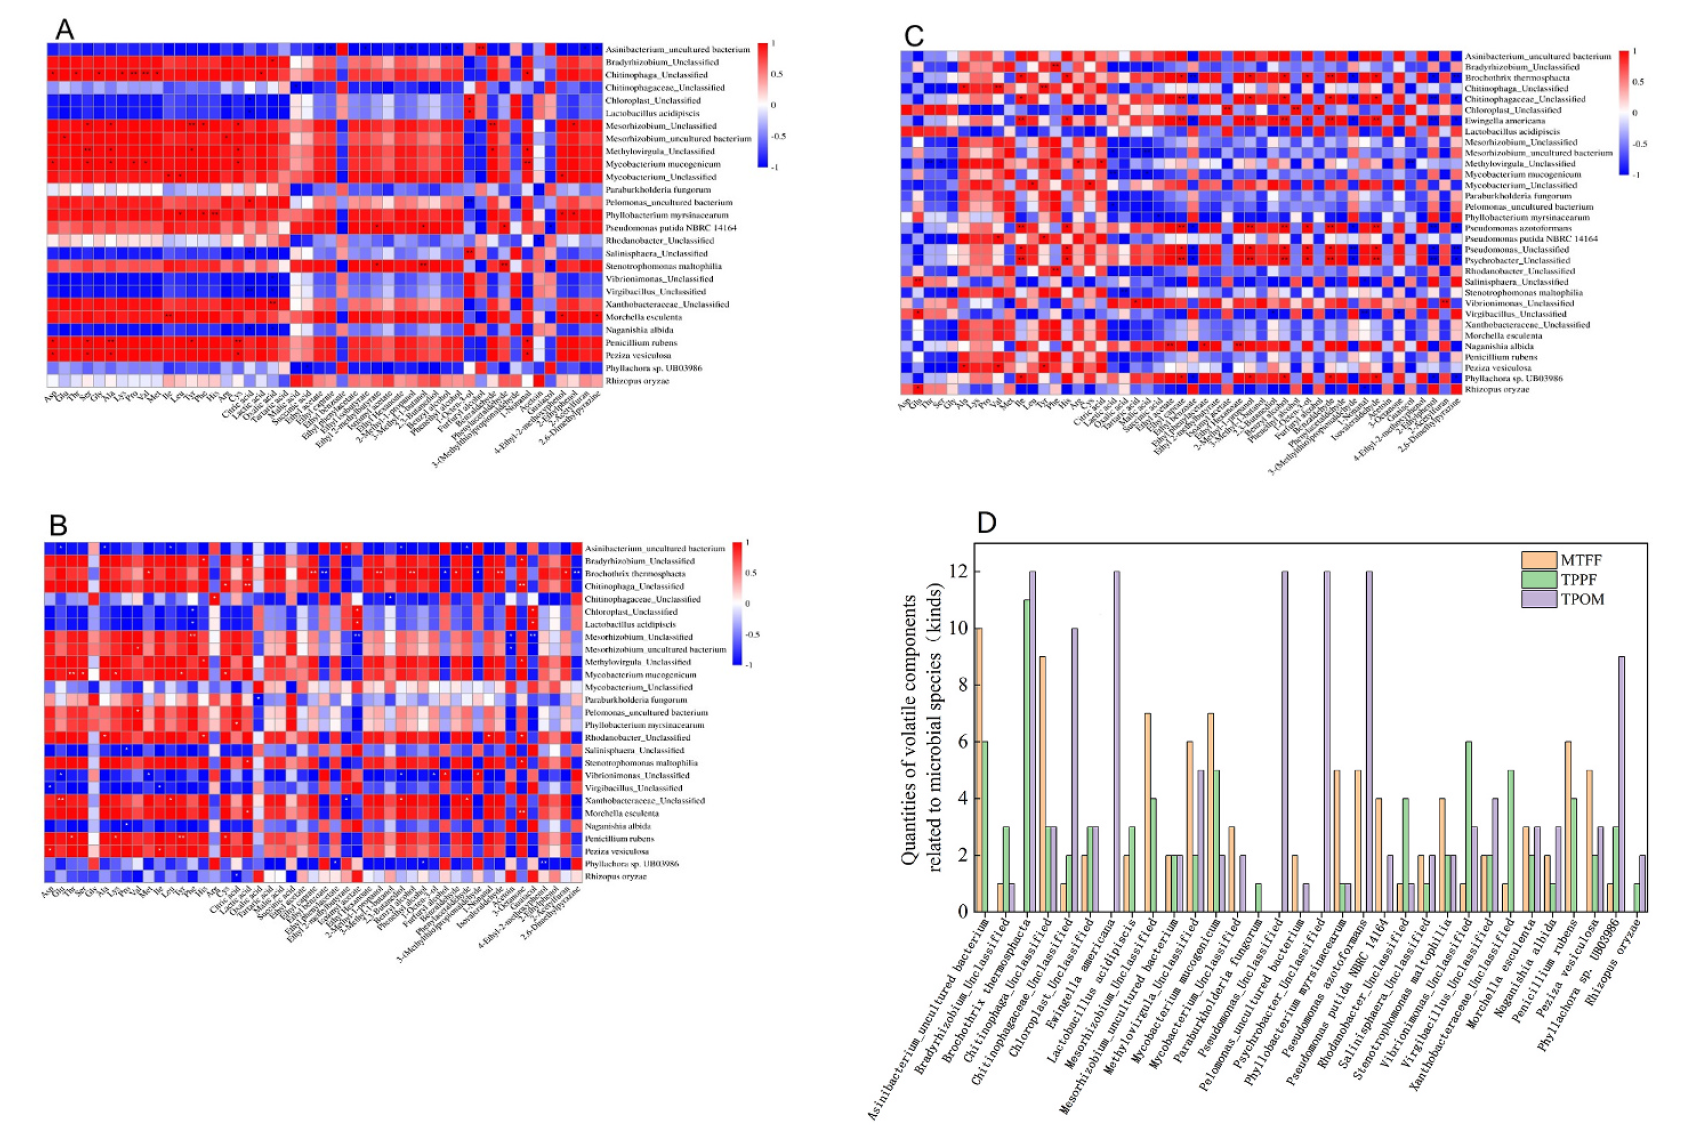
Fig. 9. Correlation analysis between flavors and microorganisms of PXDB in the three processes. (A) MTFF; (B) TPPF; (C) TPOM; (D) Kinds of flavor compounds related to microorganisms.
引用方式:The correlation index was calculated by Spearman’s correlation method using the OmicShare tools, a free online platform for data analysis (http://www.omicshare.com/tools).
参考文献:
Ye X, Liu Y, Peng C, et al. Contribution of microbial communities to flavors of Pixian Douban fermented in the closed system of multi-scale temperature and flow fields[J]. LWT, 2023, 173: 114188.
案例3:
发表期刊:LWT
影响因子:6.0
发表时间:2023
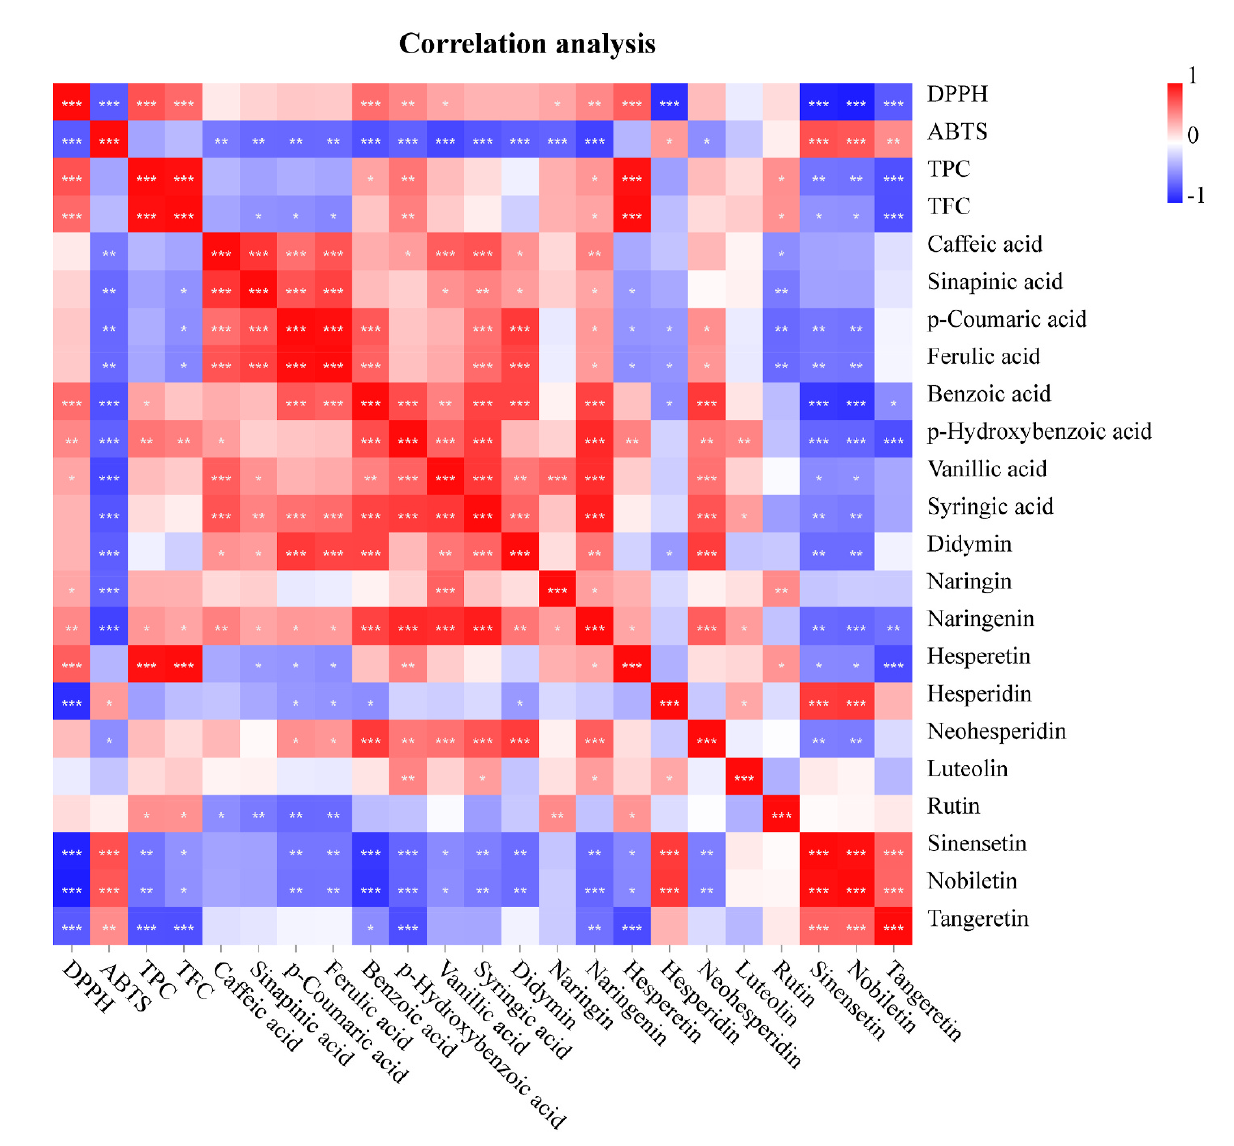
Fig. 4. Correlation map of antioxidant activity, total phenolic content (TPC), total flavonoid content (TFC), and tested phenolic compounds. *Correlation is significant between 0.01 and 0.05, ** Correlation is significant between 0.001 and 0.01, and ***correlation is significant at the 0.001 level for Pearson correlation coefficient.
引用方式:Principal component (PC) analysis (PCA) and correlation assay were applied to data set to draw chemical differences of phenolic compounds with the help of OmicShare tools, a free online platform for data analysis (http://www.omicshare.com/tools).
参考文献:
Wang Z, Mei X, Chen X, et al. Extraction and recovery of bioactive soluble phenolic compounds from brocade orange (Citrus sinensis) peels: Effect of different extraction methods thereon[J]. LWT, 2023, 173: 114337.