


 扫码支付更轻松

1. 功能
差异分析就是计算两组样本之间差异表达的基因。通常我们定义基因表达量差异倍数>2、并且P值(或Q值)小于0.05为显著差异表达的基因,具有统计学意义(阈值可根据自己研究背景自行调整)。该差异分析工具是参照软件edgeR(http://www.bioconductor.org/packages/release/bioc/html/edgeR.html)和DESeq2(http://www.bioconductor.org/packages/release/bioc/html/DESeq2.html)对两组样本间的基因差异显著性进行分析。
2. 输入
文件格式:支持txt(制表符分隔)文本文件、csv(逗号分隔)文本文件、以及Excel专用的xlsx格式,同样支持旧版Excel的xls(Excel 97-2003 )格式。
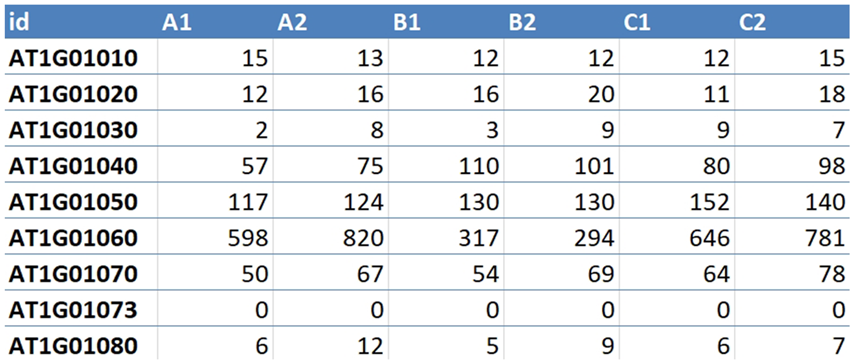
数据格式:需提供基因Count矩阵、分组信息、组间比较三个文件。
1)基因Count文件:输入的必须为基因的read count数,不是基因表达量RPKM或FPKM值!文件第一行为样本ID,第一列为基因ID,表中的数值为每个样本的基因count数(即reads数目)。
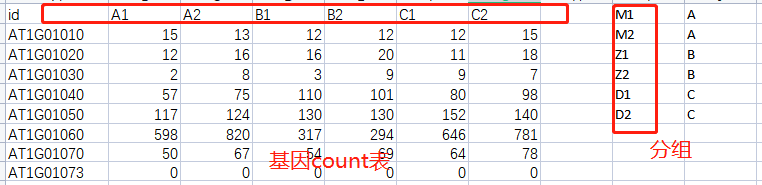
2)分组信息文件:定义分组信息,第一列为样本名,第二例为所在的组名。注意:即使没有实验重复,依然需要填写这个文件(1个样本为1组)。

3)组间比较文件:列出要进行差异分析的比较组的文件,有两列,在进行差异分析时是第二列比上第一列。如第一列是A(组),第二列是B(组),则为B组比上A组。一行为一个比较组。

3. 参数
1)软件选择:edgeR/DESeq2,选择一个软件进行差异分析。
2)检验值:用来判断差异显著性的统计检验值,可选择P值或Q值。P值为负二项分布计算得到,Q值是P值经过多重检验校正得到的。
3)检验阈值:即上面所选P值或Q值的阈值,通常选择0.05,也可以根据实验具体情况适当降低或提高阈值,如0.01、0.001等。
4)差异倍数:两组样本基因表达量的差异倍数,在基因差异表达分析中一般设定2倍。差异倍数大于设定阈值并且检验阈值(P值或Q值)小于设定阈值的基因定义为差异表达基因。
5)离散系数:用于描述实验重复间的表达量变异程度(离散程度),是表达差异分析检验的基础数值。在有实验重复的情况下,离散系数由实验重复直接估算,该参数不需要填写。在没有实验重复的情况下,则需要人为设定离散系数,以便软件可以完成检验。如果你的实验样本无实验重复,可根据自己材料的特点设定离散系数。一般而言,实验重复间的差异越大,离散系数越大。edgeR软件给出的建议为:人类样本设定为0.4,遗传背景相似的模式生物设定为0.1,技术重复设定为0.01,其他情况默认为0.01。
6)校正因子:在RNA-seq中,基因表达量(RPKM)体现为某基因表达量占总RNA表达量的比值。由于不同样本的细胞中mRNA总量有可能不同,导致RPKM值估计存在误差。因此,edgeR 可以推算校正因子,对此类误差进行校正。默认值设定为:否。
4. 输出
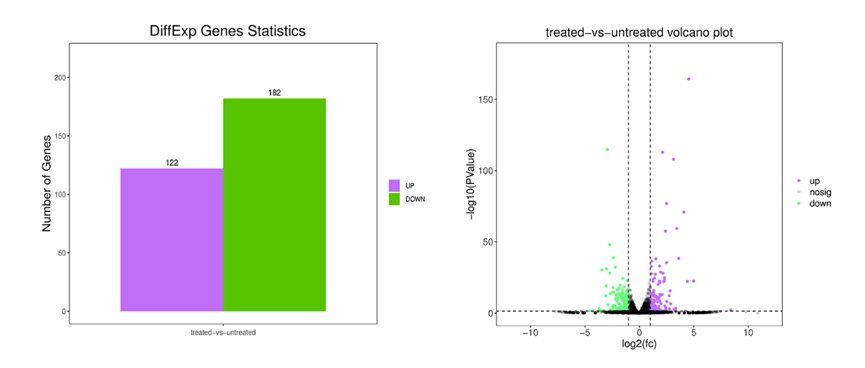
1)A-vs-B.DE.volcano.pdf:差异表达基因火山图(矢量图)
2)A-vs-B.DE.volcano.png:差异表达基因火山图(位图)
3)A-vs-B.all.xls:差异表达基因总表
4)A-vs-B.filter.xls:显著差异表达基因表(达到显著差异阈值)
5)diff.stat.pdf:所有比较组的差异表达基因柱状图(矢量图)
6)diff.stat.png:所有比较组的差异表达基因柱状图(位图)
7)diff.stat.xls:所有比较组的差异表达基因统计表


Q1. edgeR/DESeq2差异分析与配对edgeR/DESeq2差异分析工具区别?
配对edgeR/DESeq2差异分析工具会在保留样本配对关系前提下进行分析。
Q2.为什么任务出错?
差异工具出错最最常见原因有以下两点:
①上传的数据不是基因的read count数。
② 文件之间信息不对应。
在整理文件时,需要注意三个文件间样本名、分组等信息务必对应。
下面给大家举个反例!基因count表中,样本名为A1-C2,而在分组文件中,样本名是M1、M2..两个表格数据信息明显是不对应的。
Q3.没有实验重复,可以使用差异分析工具吗?
没有实验重复,可以使用edgeR进行差异分析。
Q4:为什么必须上传read count数?
A:转录组测序本质是测一条条mRNA的序列,利用不同mRNA的测序量来估计基因的表达量。这种测序引入的随机误差,不符合正态分布,而是接近于一些更复杂的混合分布,只有用原始的reads数才能正确估计测序相关的随机误差。
Q5. 提交时报错常见问题:
1.提交时显示X行X列空行/无数据,请先自查表格中是否存在空格或空行,需要删掉。
2.提交时显示列数只有1列,但表格数据不止1列:列间需要用分隔符隔开,先行检查文件是否用了分隔符。
其它提示报错,请先自行根据提示修改;如果仍然无法提交,可通过左侧导航栏的“联系客服”选项咨询OmicShare客服。
Q6.结果图片可以修改吗?如何修改?
静态工具输出的图片无法在线修改,在结果下载包中有提供位图(png)和矢量图(pdf)两种类型图片,如需修改,可以将pdf图导入AI(Adobe Illustrator)等软件进行调整。
引用OmicShare Tools的参考文献为:
Mu, Hongyan, Jianzhou Chen, Wenjie Huang, Gui Huang, Meiying Deng, Shimiao Hong, Peng Ai, Chuan Gao, and Huangkai Zhou. 2024. “OmicShare tools: a Zero‐Code Interactive Online Platform for Biological Data Analysis and Visualization.” iMeta e228. https://doi.org/10.1002/imt2.228案例1:
发表期刊:International Journal of Molecular Sciences
影响因子:5.6
发表时间:2023
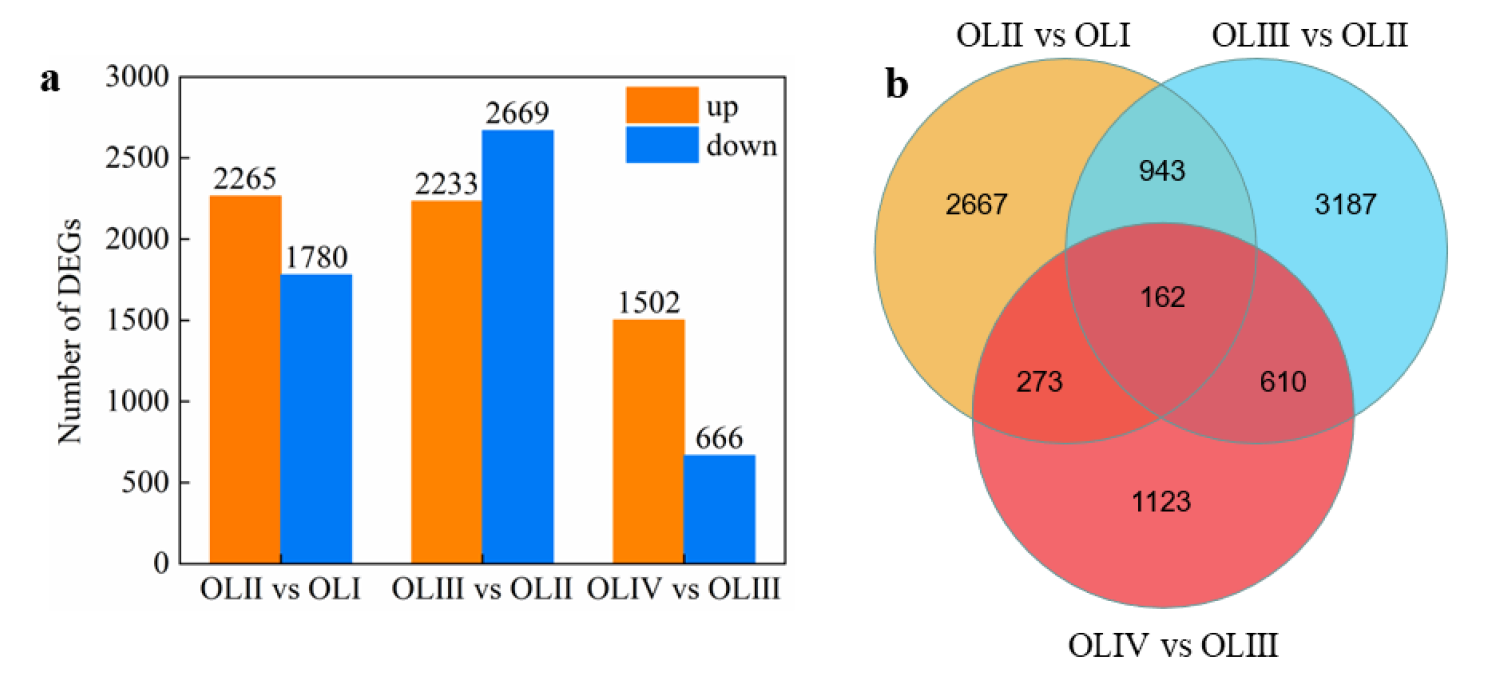
Figure 2. Numbers of DEGs in diverse pairwise comparisons (a) and Venn diagram showing the common and unique DEGs among different pairwise comparisons (b).
引用方式:GO and KEGG enrichment analyses of DEGs were performed using OmicShare tools in 2021, a free online platform for data analysis (http://www.omicshare.com/tools, 16 August 2022).
参考文献:
Guo H, Zhong Q, Tian F, et al. Transcriptome analysis reveals putative induction of floral initiation by old leaves in tea-oil tree (Camellia oleifera ‘changlin53’)[J]. International Journal of Molecular Sciences, 2022, 23(21): 13021.
案例2:
发表期刊:Scientia Horticulturae
影响因子:4.3
发表时间:2023
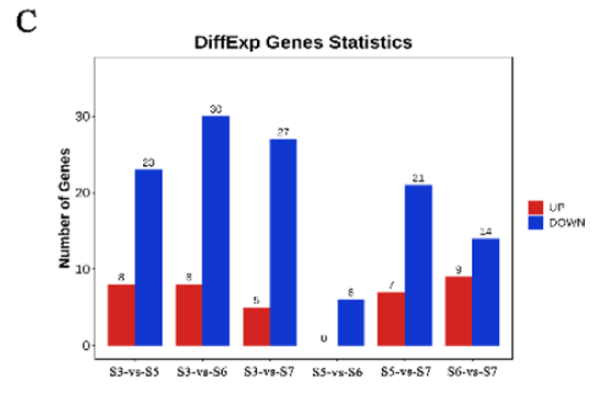
Fig. 5. Expression patterns analysis of CiB3 genes in different tissues and developmental stages. C Differential analysis of transcriptome data of CiB3s at different developmental stages of kernels.
引用方式:The count values of CiB3s expression at four different pecan developmental stages were analyzed differentially using the OmicShare Tools online website (https://www.omicshare.com/tools/Home/Soft/getsoft). Furthermore, Venn diagrams were drawn for genes with TPM values above 10 in the B3 superfamily of different tissues.
参考文献:
Wang L, Chen F, Lan Y, et al. Genome-wide identification of B3 superfamily in pecan (Carya illinoensis): In silico and experimental analyses[J]. Scientia Horticulturae, 2023, 307: 111533.
案例3:
发表期刊:Animals
影响因子:3.0
发表时间:2022
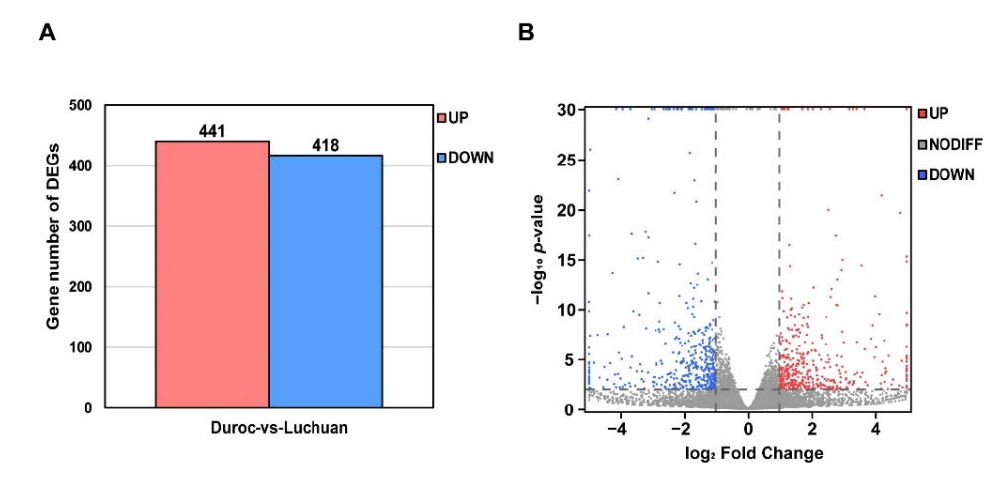
Figure 2. Identification of DEGs. (A) The statistical analysis of DEGs between Duroc and Luchuan adipose. (B) The volcano map of DEGs. The gene with p-value < 0.01 and log2 Fold Change > 1 is marked in red; the gene with p-value < 0.01 and log2 Fold Change < −1 is marked in blue.
引用方式:
Gene expression level was measured by Fragments per Kilobase per Million Mapped Fragments (FPKM) [17], the most commonly used method for estimating gene expression abundance. DEGSeq [18] was used to analyze DEGs (|Fold Change| > 2 and p-value < 0.01).The Principal Component Analysis (PCA), Gene Ontology (GO) term enrichment analysis, Kyoto Encyclopedia of Genes and Genomes (KEGG) pathway enrichment analysis and GSEA were performed using Omicshare, a real-time interactive online data analysis platform (p-value < 0.05) (http://www.omicshare.com (accessed on 18 February 2022)) [19].
参考文献:
Pan H, Huang T, Yu L, et al. Transcriptome Analysis of the Adipose Tissue of Luchuan and Duroc Pigs[J]. Animals, 2022, 12(17): 2258.
案例4:
发表期刊:Crops
发表时间:2023
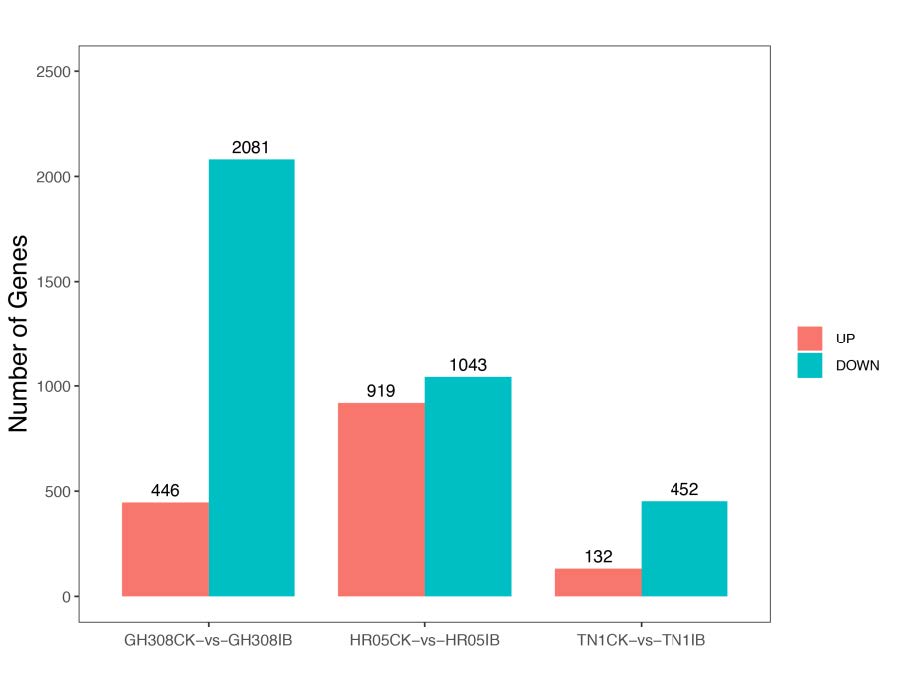
Figure 3. Statistics of differentially expressed genes in response to BPH stress.
引用方式:The OmicShare online trend analysis tool (https://www.omicshare.com/tools/Home/Soft/trend) (accessed on 15 May 2022) was used to analyze the trends of the above-mentioned differential genes.
参考文献:
Shi L, He H, Zhang J, et al. Comparative transcriptomic analysis reveals variable responses to the brown planthopper Nilaparvata lugens in different rice cultivars[J]. Crops, 2023, 3(1): 40-52.