


 扫码支付更轻松

1. 功能
1) 利用t检验(t-test)进行两组样本的差异分析。t检验是用t分布理论来推论差异发生的概率,从而比较两个平均数的差异是否显著。
2) 利用Wilcoxon秩和检验进行两组样本的差异分析。Wilcoxon秩和检验,也称Mann-Whitney U检验,是一种非参数检验,在不需要假设两个样本空间都为正态分布的情况下,测试它们的分布是否完全相同。
3) 在箱线图上添加两样本间的显著性连线与标记。
工具兼容两组及多组数据,两组及三组示例图如下:
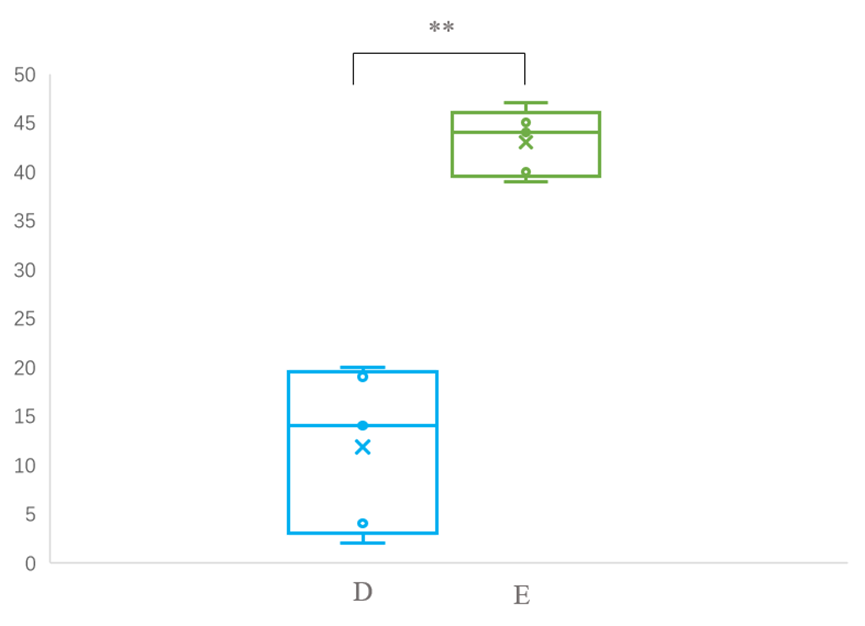
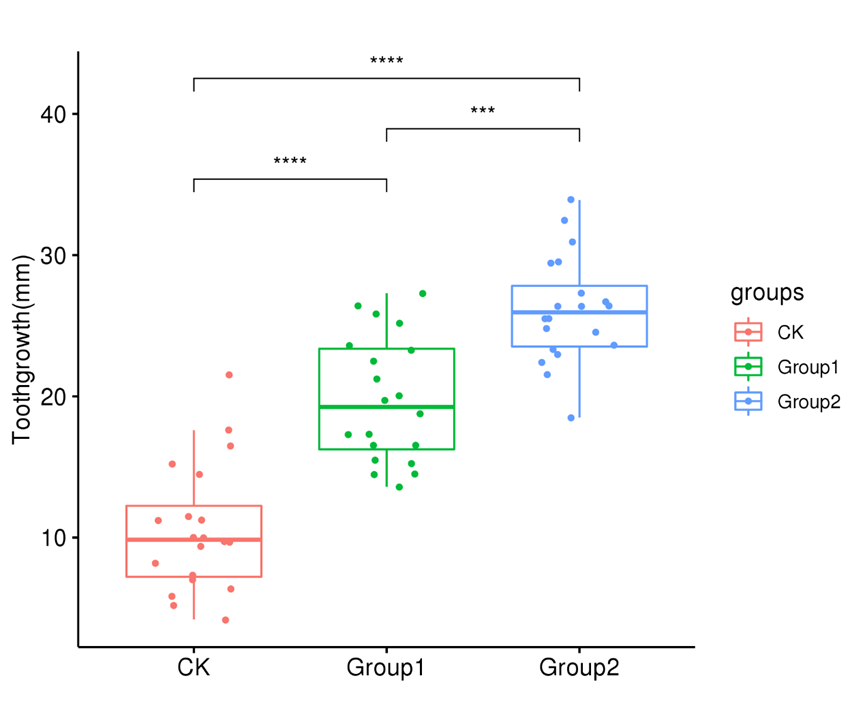
*代表p值小于0.05,**代表p值小于0.01,***代表p值小于0.001
详细案例教程:https://www.omicshare.com/forum/thread-7179-1-1.html
2. 输入
文件格式:支持txt(制表符分隔)文本文件、csv(逗号分隔)文本文件、以及Excel专用的xlsx格式,同样支持旧版Excel的xls(Excel 97-2003 )格式。
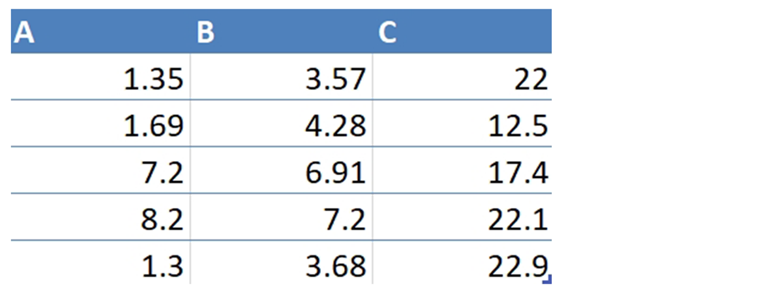
数据格式:差异检验表格文件,第一行是不同比较组的名称,之后每一列为该比较组每个重复的数据,每个分组内至少要有3次重复,提交后会对组样品进行两两分组比较。
3. 结果输出
结果文件中提供差异检验结果表、检验箱线图:
1)Ttest.Pvalue. xls: T检验差异检验结果(参数选择T检验,输出的是T检验差异检验结果表格)
2)T-test.diff.pdf/png:t检验箱线图(参数选择T检验,输出的是t检验箱线图)
3)wilcox.diff.pdf/png:秩和检验箱线图(参数选择秩和检验,输出的是秩和检验箱线图)
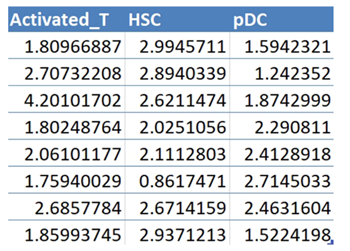
1. 输入文件
差异检验表格:
2. 输出文件
1)差异分析结果表格:
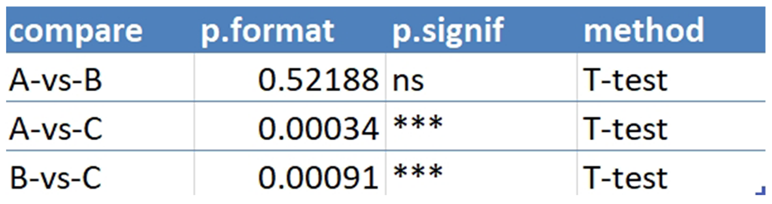
注:表头从左到右显示比较组、P值、显著性和差异分析方法。*代表p值小于0.05,**代表p值小于0.01,***代表p值小于0.001
2)检验箱线图:
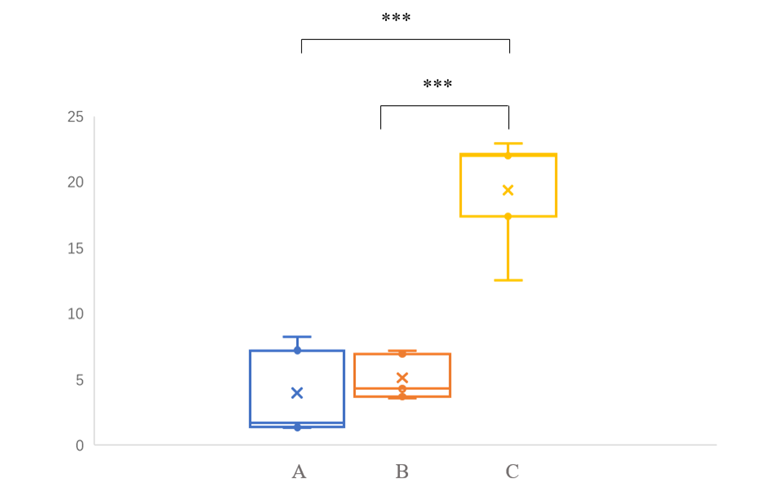
注:横坐标为三个比较组名称,纵坐标为样本数据的分布值。*代表显著性,*代表两组间差异小于0.05.**代表两组间差异小于0.01,***代表两组间差异小于0.001,以此类推。
Q1. 提交为什么显示有重复值?

如果行名参数选择“是”,即代表您的表格中第一列为样本名;其中样本名(既第一列的行名)是不允许重复的。
①如果第一列即为数据,则行名选择“否”
②如果确实有样本名,则修改重复值。
Q2.图上的***分别代表什么?
*代表p值小于0.05
**代表p值小于0.01
***代表p值小于0.001
ns大于0.05,为不显著。
Q3. 提交时报错常见问题:
1.提交时显示X行X列空行/无数据,请先自查表格中是否存在空格或空行,需要删掉。
2.提交时显示列数只有1列,但表格数据不止1列:列间需要用分隔符隔开,先行检查文件是否用了分隔符。
其它提示报错,请先自行根据提示修改;如果仍然无法提交,可通过左侧导航栏的“联系客服”选项咨询OmicShare客服。
Q4. 提交的任务完成后却不出图该怎么办?
主要原因是上传的数据文件存在特殊符号所致。可参考以下建议逐一排查出错原因:
(1)数据中含中文字符,把中文改成英文;
(2) 数据中含特殊符号,例如 %、NA、+、-、()、空格、科学计数、罗马字母等,去掉特殊符号,将空值用数字“0”替换;
(3)检查数据中是否有空列、空行、重复的行、重复的列,特别是行名(一般为gene id)、列名(一般为样本名)出现重复值,如果有删掉。
排查完之后,重新上传数据、提交任务。如果仍然不出图,可通过左侧导航栏的“联系客服”选项咨询OmicShare客服。
Q5. 提交的任务一直在排队怎么办?
提交任务后都需要排队,1分钟后,点击“任务状态刷新”按钮即可。除了可能需运行数天的注释工具,一般工具数十秒即可出结果,如果超出30分钟仍无结果,请联系OS客服,发送任务编号给OmicShare客服,会有专人为你处理任务问题。
Q6. 结果页面窗口有问题,图表加载不出来怎么办?
尝试用谷歌浏览器登录OmicShare查看结果文件,部分浏览器可能不兼容。
引用OmicShare Tools的参考文献为:
Mu, Hongyan, Jianzhou Chen, Wenjie Huang, Gui Huang, Meiying Deng, Shimiao Hong, Peng Ai, Chuan Gao, and Huangkai Zhou. 2024. “OmicShare tools: a Zero‐Code Interactive Online Platform for Biological Data Analysis and Visualization.” iMeta e228. https://doi.org/10.1002/imt2.228案例1
发表期刊:International Journal of Molecular Sciences
影响因子:5.6
发表时间:2023
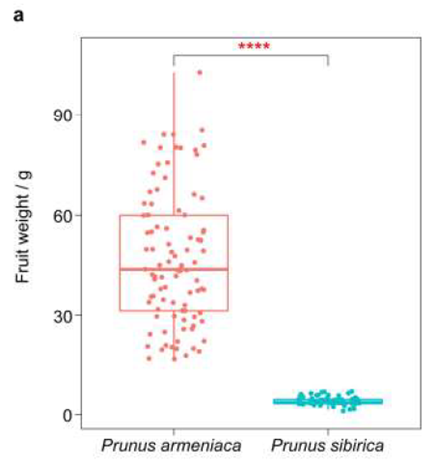
Figure 1. Fruit development and cell growth dynamics of large ‘Sungold’ fruit and small ‘F43’
fruit. (a) Fruit weight in P. armeniaca and P. sibirica. Significance testing was conducted using T-test (**** p < 2*10-16).
引用方式:
In the analysis of the difference in fruit weight between P. armeniaca and P. sibirica, the significance boxplot with a T-test was plotted by using the OmicShare tools platform.
参考文献:
Huang M, Zhu X, Bai H, et al. Comparative Anatomical and Transcriptomics Reveal the Larger Cell Size as a Major Contributor to Larger Fruit Size in Apricot[J]. International Journal of Molecular Sciences, 2023, 24(10): 8748.
案例2
发表期刊:Research Square(预印本)
发表时间:2022
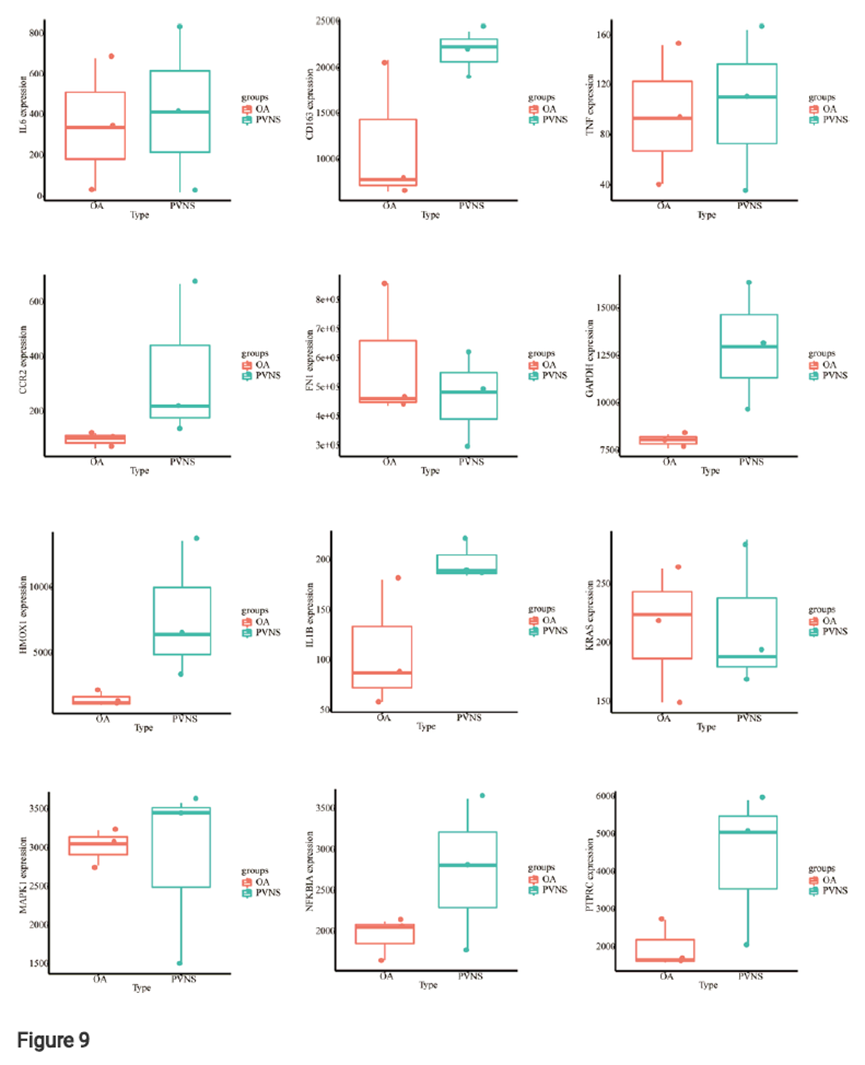
12 specifically expressed hub genes were verified by 1 data set of GEO database. Dataset: GSE176133. The expression of all hub genes in PVNS samples was significantly higher than that in OA samples (p < 0.05).
引用方式:
Use Omicshare online tools (https://www.omicshare.com/) for statistical analysis. T-test was used to analyze the difference between the two groups of samples and draw the box diagram.
参考文献:
Yuan Liu, Xuezhen Liang, Bo Xu et al. Identification of potential biomarkers of pigmented villonodular synovitis by bioinformatics and related transcriptome analysis, 02 June 2022, PREPRINT (Version 1) available at Research Square [https://doi.org/10.21203/rs.3.rs-1707206/v1]
案例3
发表期刊:International Journal of Molecular Sciences
影响因子:5.6
发表时间:2022
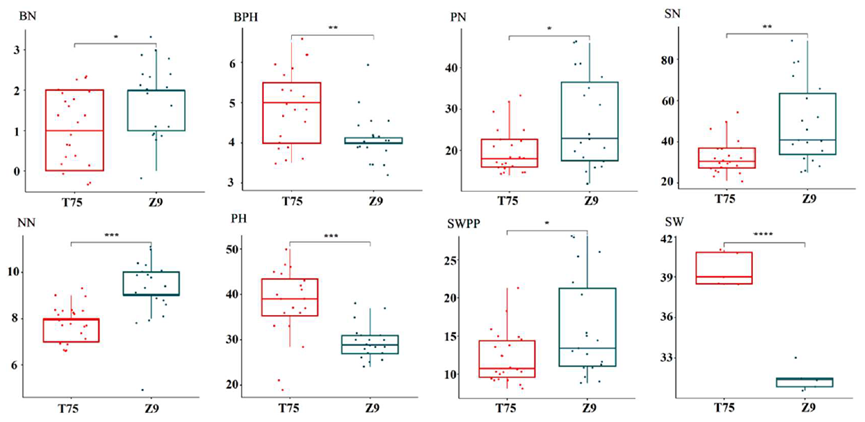
Figure 1. Agronomic traits of soybean "Taiwan 75' (I75) and 'Zhexian 9' (Z9). BN, number of branches;PN, number of pods per plant; NN, number of nodes in main stem; BPH, lowermost pod height; PHplant height; SN, number of seeds per plant; SWPP, seed weight per plant; and SW, 100-seed weight* p < 0.05, ** p < 0.01, *** and **** p < 0.001(Student's t-test).
引用方式:
The data were analyzed with EXCEL 2013, LSD Multiple Comparison in ANOVA and box plots were generated using the OmicShare tools, a free online platform for data analysis (https://www.omicshare.com/tools, accessed on 7 August 2015). A Student’s t-test was used to analyze the significance of differences between the means for the two varieties.
参考文献:
Jin H, Fu X, Yu X, et al. Genome-wide comparison of structural variations and transposon alterations in soybean cultivars induced by spaceflight[J]. International Journal of Molecular Sciences, 2022, 23(22): 13721.