


 扫码支付更轻松

功能
根据输入的表格信息和分组信息,利用0/1二值热图展示数据分析结果。
输入
文件格式:支持txt(制表符分隔)文本文件、csv(逗号分隔)文本文件、以及Excel专用的xlsx格式,同样支持旧版Excel的xls(Excel 97-2003 )格式。表格名称以字母、数字、下划线组成,不可以有空格。
文件类型:
Type1:基于数值展示
示例文件:
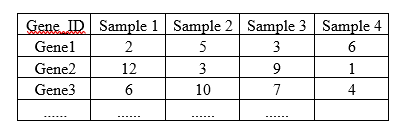
注意:为了更佳的可视化效果,建议Type1输入基因数量低于150个。
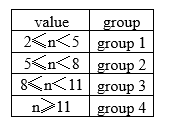
分组文件:
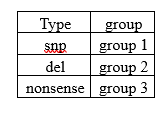
Type2:基于文本展示
示例文件:
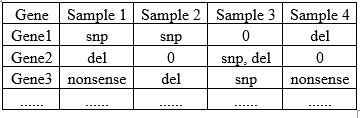
注意:如果一个模块中有多个文本信息,文件仅支持英文输入法的";"和","作为分隔符,此时会根据分组文件同时呈现模块中的信息。
分组文件:
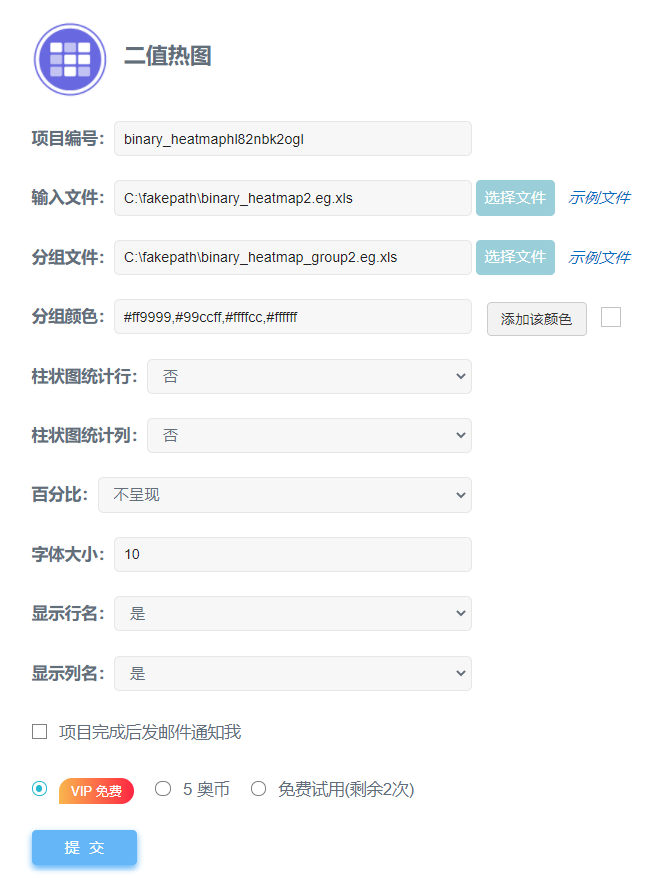
参数
分组颜色:需自行添加颜色。要注意颜色数量要与分组数量相等,即有多少个分组,就要添加多少个不同的颜色。
添加颜色方式:
① 添加/修改颜色可用十六进制色号,每个颜色用英文输入法下的逗号隔开 (例如有三个分组,分别给每组设定黑色、绿色、红色,可输入#000000,#008000,#FF0000)。
② 可直接通过调色板选取需要的颜色:点击带颜色小方格选中所需颜色后点击添加该颜色即可。
柱状图统计行:即每行显示分组信息方格的堆叠统计图,生物学意义可以是对基因在不同样本表达量变化统计,或基因中突变类型统计。默认为否,可自选。
柱状图统计列:即每列显示分组信息方格的堆叠统计图,生物学意义可以是样本中,目标基因的表达量变化统计,或样本中目标基因的突变类型统计。默认为否,可自选。
字体大小:默认为10,可调整。
百分比:默认不呈现,可选。
显示行名:默认是,可选。
显示列名:默认是,可选。
输出
result.heatmap.png/pdf
可输出pdf和png两种图片格式的图片到本地。
数据整理
文件格式及内容详见说明部分。
文件输入
输入矩阵表格文件和分组文件。
参数选择:
分组颜色:自行添加颜色,有几个分组即添加几种颜色。
柱状图统计行:默认否,可选。
柱状图统计列:默认否,可选。
字体大小:默认为10,可调整。
百分比:默认不呈现,可选。
显示行名:默认是,可选。
显示列名:默认是,可选。
文件输出:
在“我的项目”中查看任务进度及结果,点击“预览”可在线查看二值热图,点击“下载”可将二值热图相关图片及文件下载到本地。

result.heatmap.png/pdf
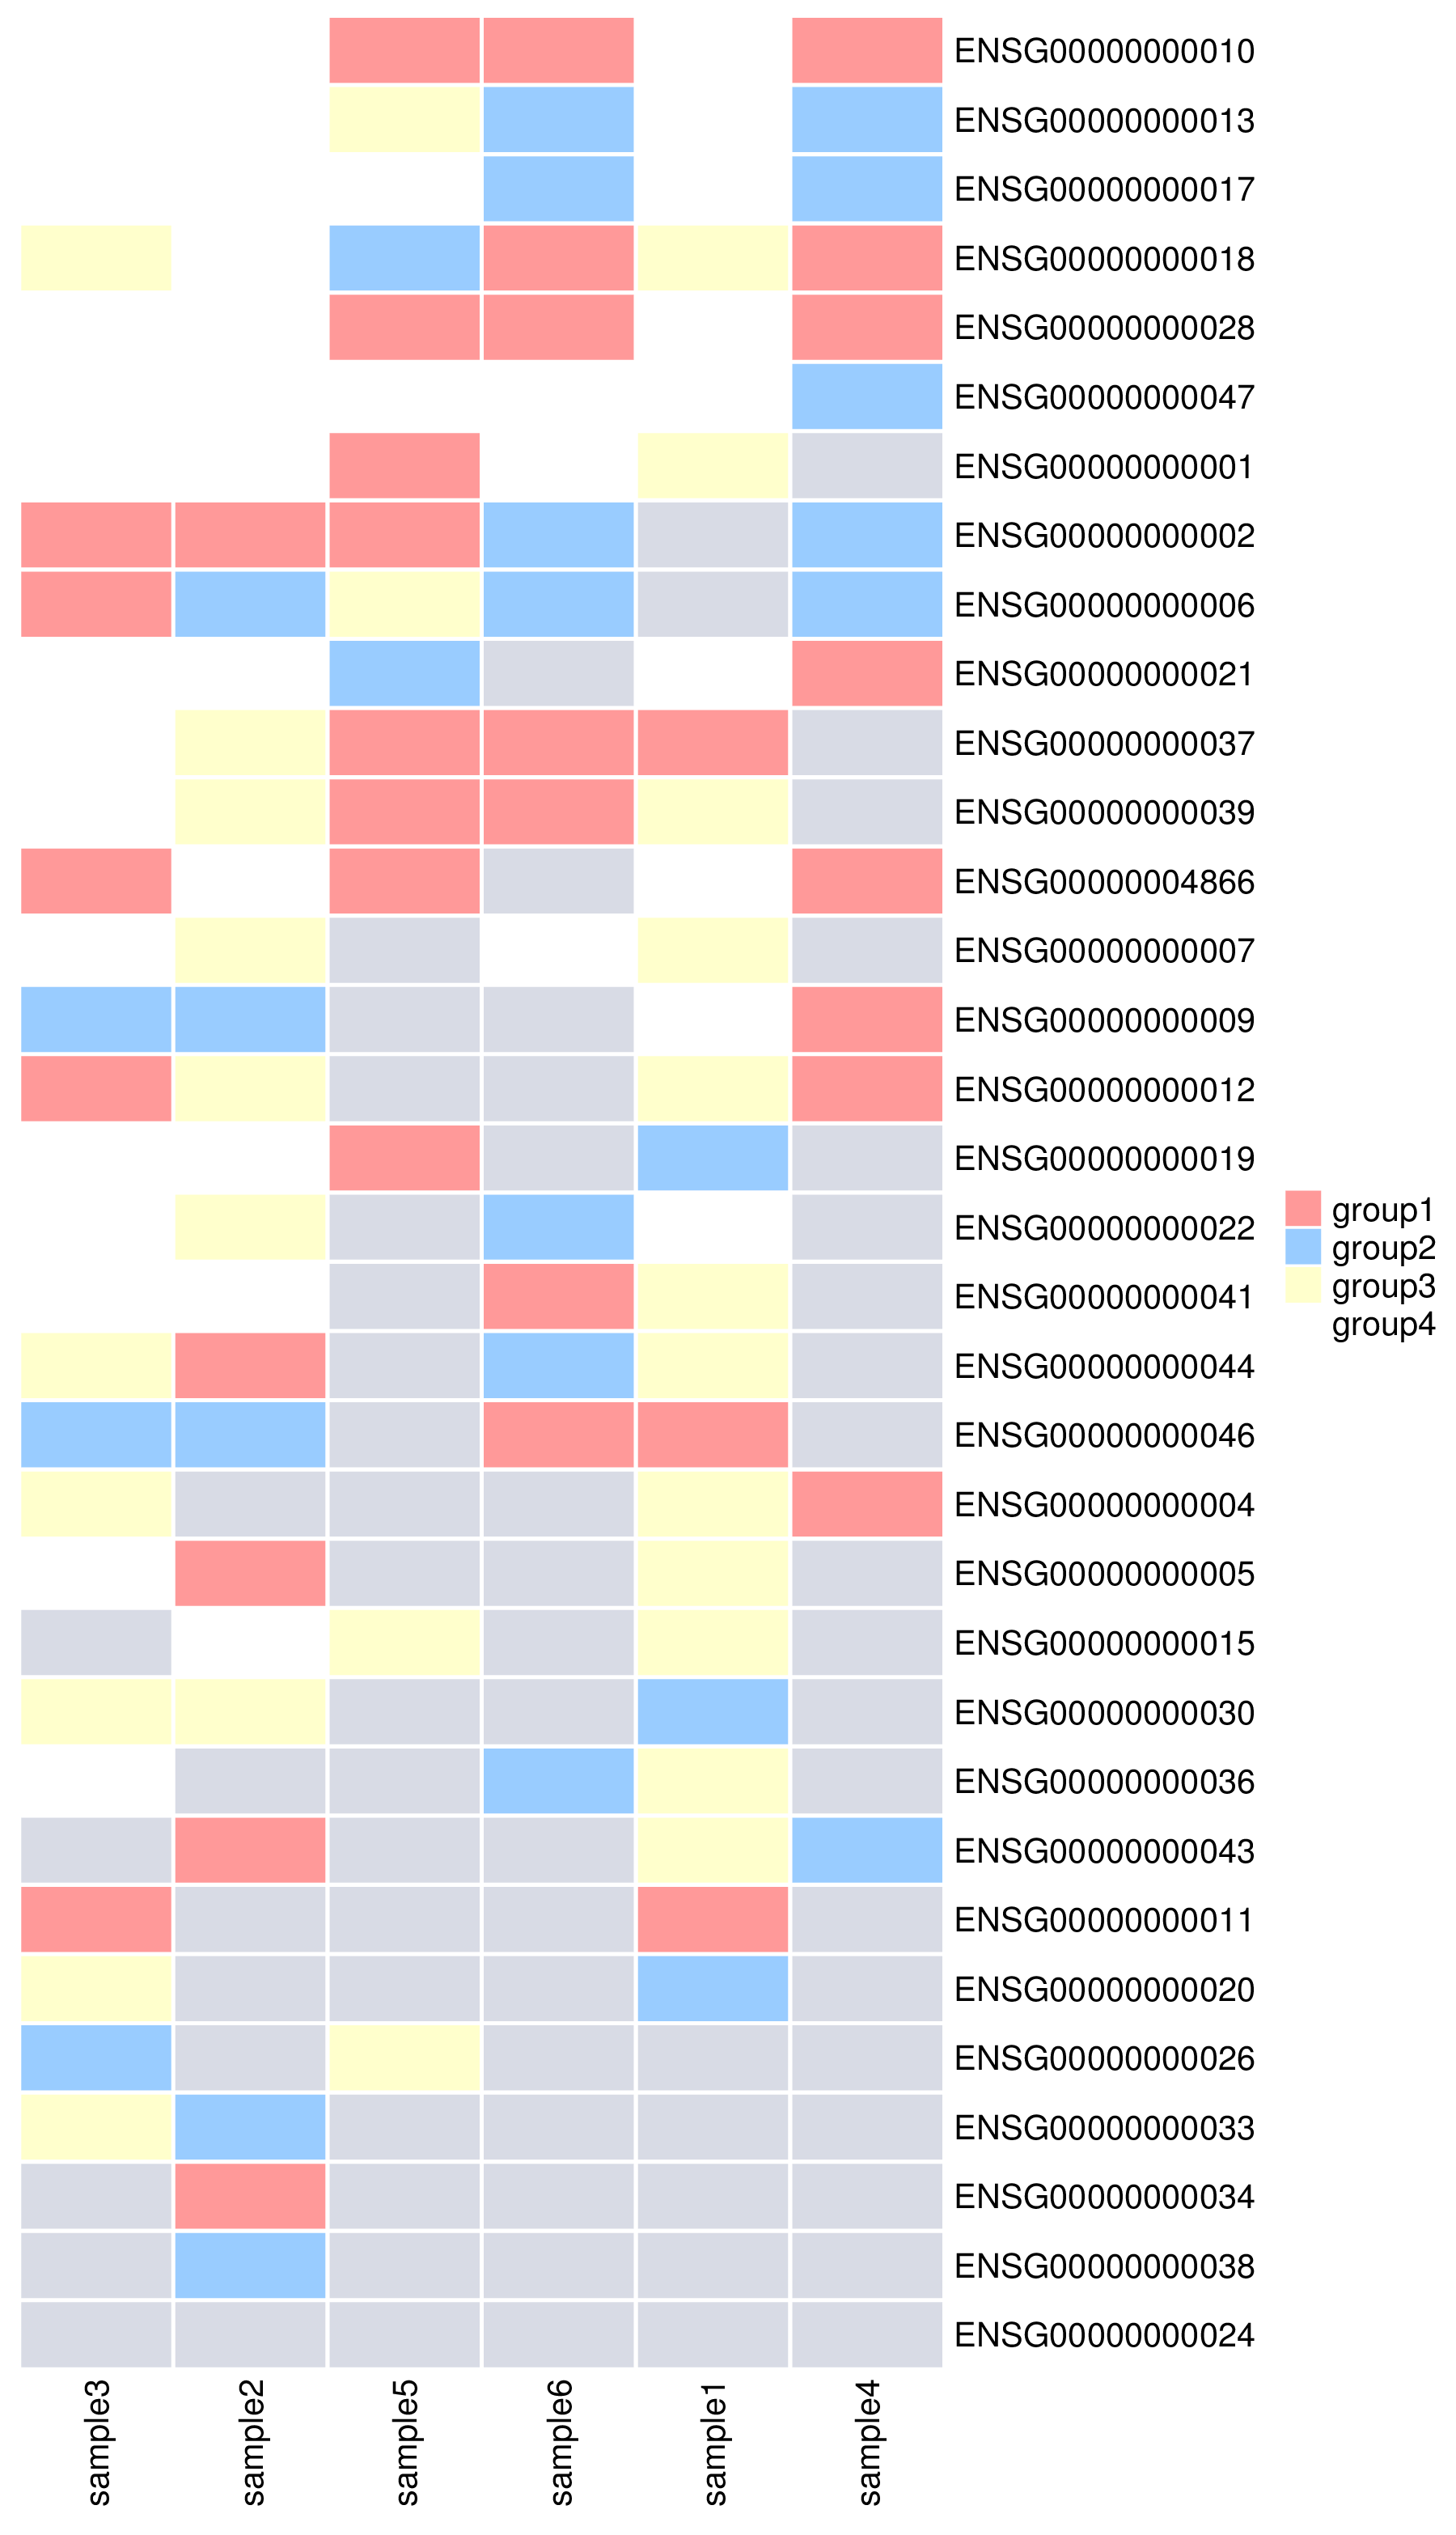
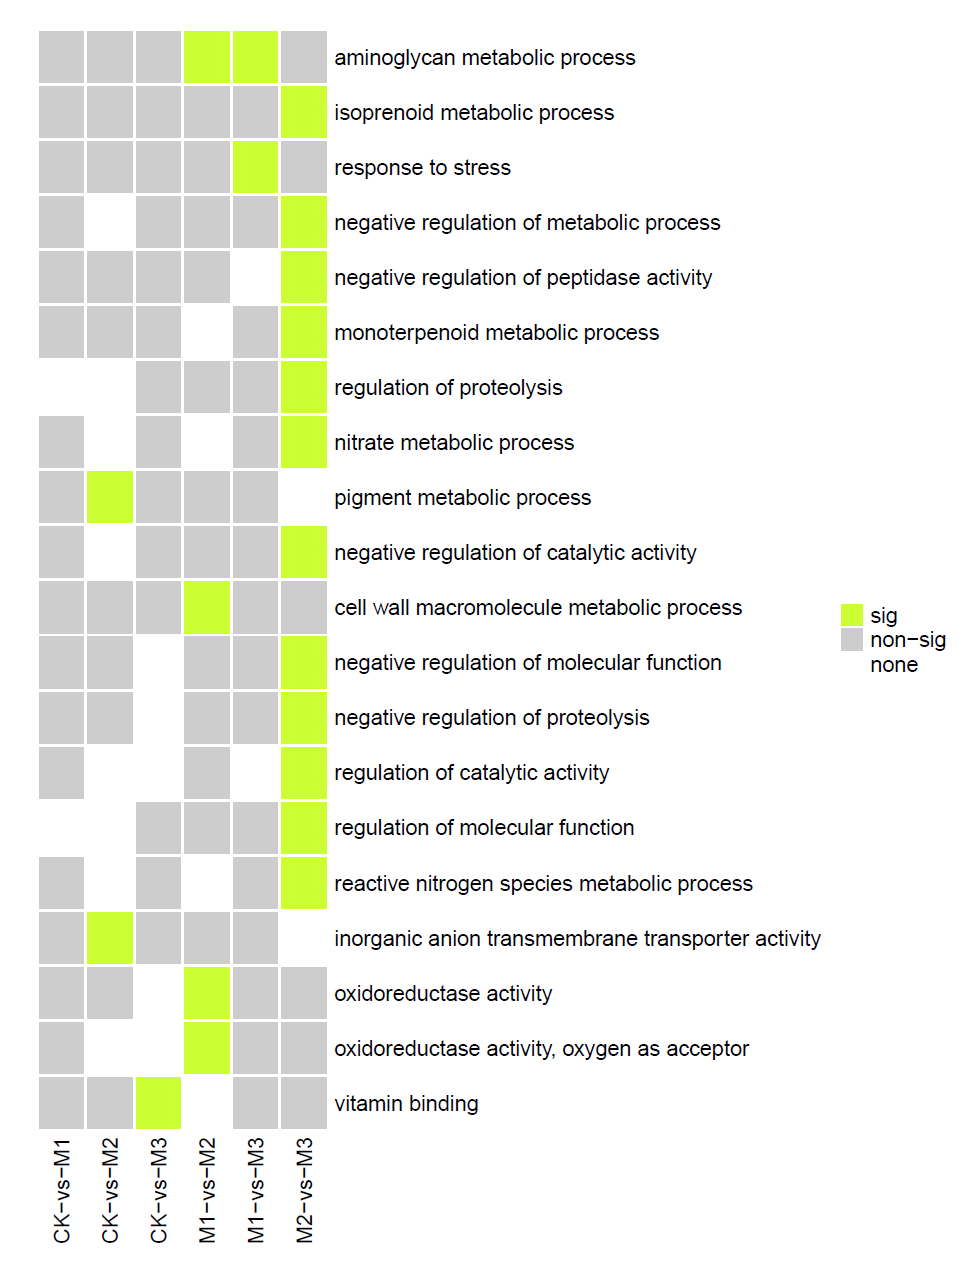
二值热图
灰色方格表示数值不在分组范围内或无此信息。
Q1. 上传的数据需要保存成什么格式?文件名称和拓展名有没有要求?
OmicShare当前支持txt(制表符分隔)文本文件、csv(逗号分隔)文本文件、以及Excel专用的xlsx格式,同样支持旧版Excel的xls(Excel 97-2003 )格式。如果是核酸、蛋白序列文件,必须为FASTA格式(本质是文本文件)。
文件名可由英文和数字构成,文件拓展名没有限制,可以是“.txt”、“.xlsx”、“.xls”、“.csv”“.fasta”等,例如 mydata01.txt,gene02.xlsx 。
Q2. 提交时报错常见问题:
1.提交时显示X行X列空行/无数据,请先自查表格中是否存在空格或空行,需要删掉。
2.提交时显示列数只有1列,但表格数据不止1列:列间需要用分隔符隔开,先行检查文件是否用了分隔符。
其它提示报错,请先自行根据提示修改;如果仍然无法提交,可通过左侧导航栏的“联系客服”选项咨询OmicShare客服。
Q3. 提交的任务完成后却不出图该怎么办?
主要原因是上传的数据文件存在特殊符号所致。可参考以下建议逐一排查出错原因:
(1)数据中含中文字符,把中文改成英文;
(2) 数据中含特殊符号,例如 %、NA、+、-、()、空格、科学计数、罗马字母等,去掉特殊符号,将空值用数字“0”替换;
(3)检查数据中是否有空列、空行、重复的行、重复的列,特别是行名(一般为gene id)、列名(一般为样本名)出现重复值,如果有删掉。
排查完之后,重新上传数据、提交任务。如果仍然不出图,可通过左侧导航栏的“联系客服”选项咨询OmicShare客服。
Q4.下载的结果文件用什么软件打开?
OmicShare云平台的结果文件(例如,下图为KEGG富集分析的结果文件)包括两种类型:图片文件和文本文件。

图片文件:
为了便于用户对图片进行后期编辑,OmicShare同时提供位图(png)和矢量图(pdf、svg)两种类型的图片。对于矢量图,最常见的是pdf和svg格式,常用Ai(Adobe illustrator)等进行编辑。其中,svg格式的图片可用网页浏览器打开,也可直接在word、ppt中使用。
文本文件:
文本文件的拓展名主要有4种类型:“.os”、“.xls”、“.log”和“.txt”。这些文件本质上都是制表符分隔的文本文件,使用记事本、Notepad++、EditPlus、Excel等文本编辑器直接打开即可。结果文件中,拓展名为“.os”文件为上传的原始数据;“.xls”文件一般为分析生成的数据表格;“.log”文件为任务运行日志文件,便于检查任务出错原因。
Q5. 提交的任务一直在排队怎么办?
提交任务后都需要排队,1分钟后,点击“任务状态刷新”按钮即可。除了可能需运行数天的注释工具,一般工具数十秒即可出结果,如果超出30分钟仍无结果,请联系OS客服,发送任务编号给OmicShare客服,会有专人为你处理任务问题。
Q6. 结果页面窗口有问题,图表加载不出来怎么办?
尝试用谷歌浏览器登录OmicShare查看结果文件,部分浏览器可能不兼容。