扫码支付更轻松

Function:
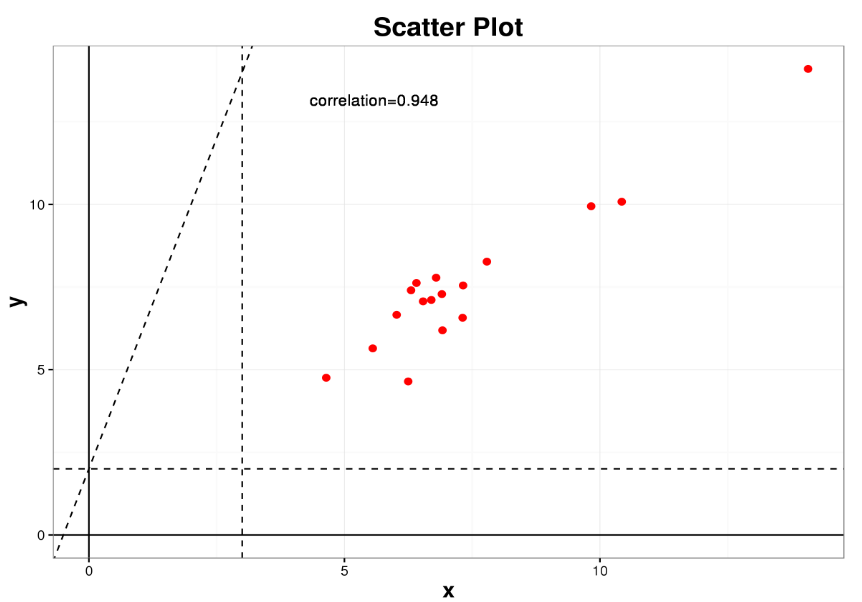
Demonstrate file data in a scatter plot with auxiliary lines and correlation coefficient.
Input:
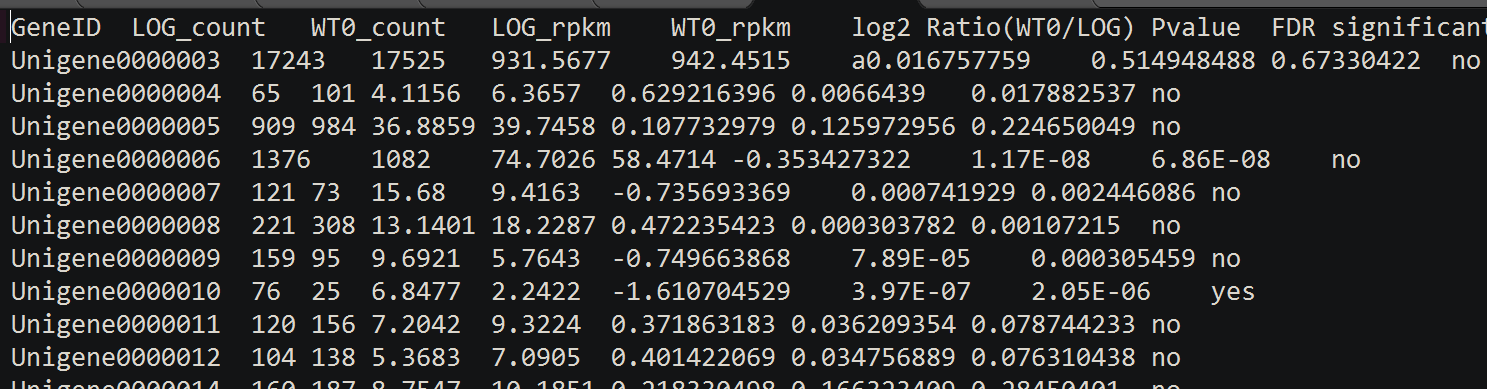
Input a tab delimited text file. If your data is not TAB delimited, you can use Excel to convert it.
Here is an example:
Parameters:
①Title of scatter plot: Define the title of the scatter plot.
②Column for x-axis/ y-axis variables: You can choose which column for x-axis/ y-axis, and self-define the title of x-axis/ y-axis.
③Data pre-processing: There are three ways to pre-process data: log2 transformed, log10 transformed, none.
④Color of points: Define the color of points in the scatter plot.
⑤Headers: Headers are optional. We recommend a file with headers. The parameters below are optional:
⑥Range the x-axis/ y-axis: Input the minimum value and maximum value of x-axis/ y-axis.
⑦Correlation coefficient: There are three types of correlation coefficient:
Pearson correlation coefficient: For linear correlation of two variables.
Spearman’s rank correlation coefficient: For rank correlation of two variables.
Kendall rank correlation coefficient: For ordinal association between two variables.
⑧Axis: You can choose display or not to display the x-axis and y-axis.
⑨Auxiliary lines: There are three types of auxiliary lines
a.Input y-intercept for an auxiliary line parallel to the x-axis. For example, input “2”, then an auxiliary line of y=2 will be drawn.
b.Input x-intercept for an auxiliary line parallel to the y-axis. For example, input “2”, then an auxiliary line of x=2 will be drawn.
c.Input y-intercept and slope. For example, input “1,2”, then an auxiliary line of y=2x+1 will be drawn.
Output:
A scatter plot in PDF format and PNG format.