扫码支付更轻松

Function:
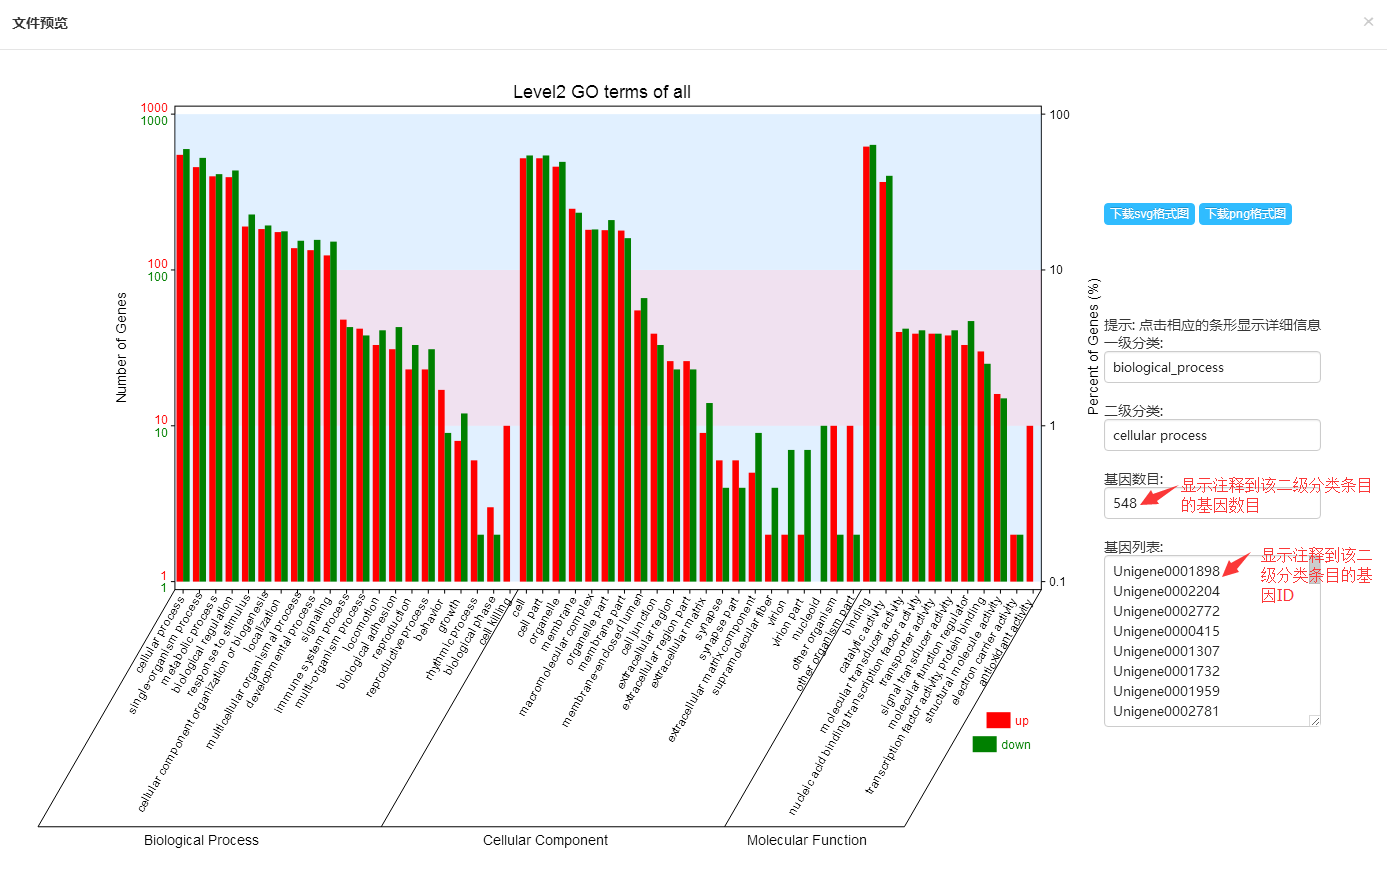
Plotting GO (gene ontology) annotations (the second level) in three GO ontologies from one or more groups of data.
Input:
input a GO annotation file of all groups and a grouping file. In the GO annotation file, the first column presents gene IDs and the rest columns present GO IDs. In the grouping file, the first column is gene IDs, and the second column is group names.
Unigene0000004  GO:0002376  GO:0005126
Unigene0000005  GO:0048469  GO:0046914  GO:0042127  GO:0005515  GO:0000982  GO:0006357  GO:0043231  GO:0038023  GO:0009755  GO:0022602  GO:0003677  GO:0030518
Unigene0000009  GO:0005198
Unigene0000010  GO:0005198
Unigene0000016  GO:0003676  GO:0016479  GO:0043232  GO:0097191  GO:0009895
Unigene0000027  GO:0016842  GO:0043231  GO:0043234  GO:0043409  GO:0017016  GO:0000226  GO:0044444  GO:0065003  GO:0097485
Unigene0000028  GO:0043231  GO:0043234  GO:0043409  GO:0017016  GO:0000226  GO:0044444  GO:0065003  GO:0097485
Unigene0000034  GO:0010508  GO:0046914  GO:0060089  GO:0010629  GO:0051091  GO:0044432  GO:0043161  GO:0016567  GO:0031090  GO:0008219  GO:0010212  GO:0043122  GO:0006952  GO:0019787  GO:1902186
Unigene0000040  GO:0019842  GO:0016829  GO:0046872  GO:0009062  GO:0042579  GO:0006461  GO:0005515
Unigene0000043  GO:0006810  GO:0031224
Unigene0000051  GO:0043169  GO:0017111
  .   .   .   .   .
Parameters :
① GO Database: We support 4 versions of GO databases including:
② Chart type: There are two options: dodge histogram and stack histogram. Dodge means each group is shown side by side. Stack means each group of data is shown in a stack chart.
③ Percentage on Y-axis: Percentage of genes with a certain GO annotation. You can choose whether or not to display the percentage on the right y-axis.
④ Log10 transformation of y-axis: You can scale the data using log10 transformation if gene numbers of different GO terms vary widely. For stack histogram, log10 transformation is not allowed.
⑤ Color: Define the color of each group (two groups or more) or each GO ontology (only one group).
⑥ Background pattern: There are three patterns for the background. Range: the background is multicolor. Bar: the background is line. Null: no background.
Output:
① osgo.png: a scalar figure of second level GO annotation histogram.
② All GO level2 bar. svg: a vector figure of second level GO annotation histogram.
③ All Go level2. stat. xls: annotation information table.