扫码支付更轻松

The use of variance analysis tool and interpret detailed tutorial
Function:
Differential expression analysis tool is used to find out differentially expressed genes between two groups of data. In general, the thresholds of significantly differential expression are expression fold change >2 and P value/Q value <0.05. This tool refers to edgeR tool (http://www.bioconductor.org/packages/release/bioc/html/edgeR.html)and DESeq2 (http://www.bioconductor.org/packages/release/bioc/html/DESeq2.html)to analyze differentially expressed genes between two groups.
Input:
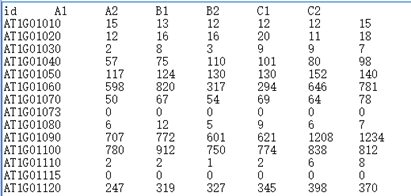
①Input a tab delimited text file with headers. The first row is sample names and the first column is gene IDs. Values in the table are gene count numbers (read numbers)
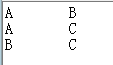
②Input a tab delimited text file where a row represents a comparison with the first column versus the second column.
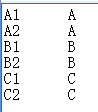
③Input a tab delimited text file where sample names in the first column and group names in the second column. Note that this grouping file is also necessary for experiments without biological replicates.
Parameters:
①Software choice: Edger/Deseq2. Choose a software for difference analysis.
②Test value: you can choose P value or Q value for test value. P value is calculated by negative binomial distribution. Q value (false discovery rate, FDR) is calculated by FDR correction of P value.
③Threshold for P value or Q value. Normally, the threshold for differential expression analysis is 0.05. You can also set the threshold according to your experiment, like 0.01 or 0.001.
④The expression fold change of genes between two groups. Normally, the threshold of fold change is 2. We defined genes with a fold change over the threshold (e.g 2) and test value lower than the threshold (e.g 0.05) as differentially expressed genes.
⑤Coefficient of Variation is used to describe the degree of dispersion across biological replicates. For experiments with replicates, CV value will be calculated according to the biological replicates within a group and you don’t need to set the CV value here. For experiments without replicates, you need to set a CV value here. We recommend that for human samples 0.4, for model organisms with similar genetic backgrounds 0.1, others 0.01.
⑥NormFactors:In RNA-seq, the expression of a gene (RPKM) is measured as the ratio of this gene’s expression and total RNAs’ expression. However, due to the possible difference of total RNA counts between different samples, the estimation of RPKM may lead to error. Hence, edgeR tool can use NormFactors to correct this kind of error. Default: No.
Output:
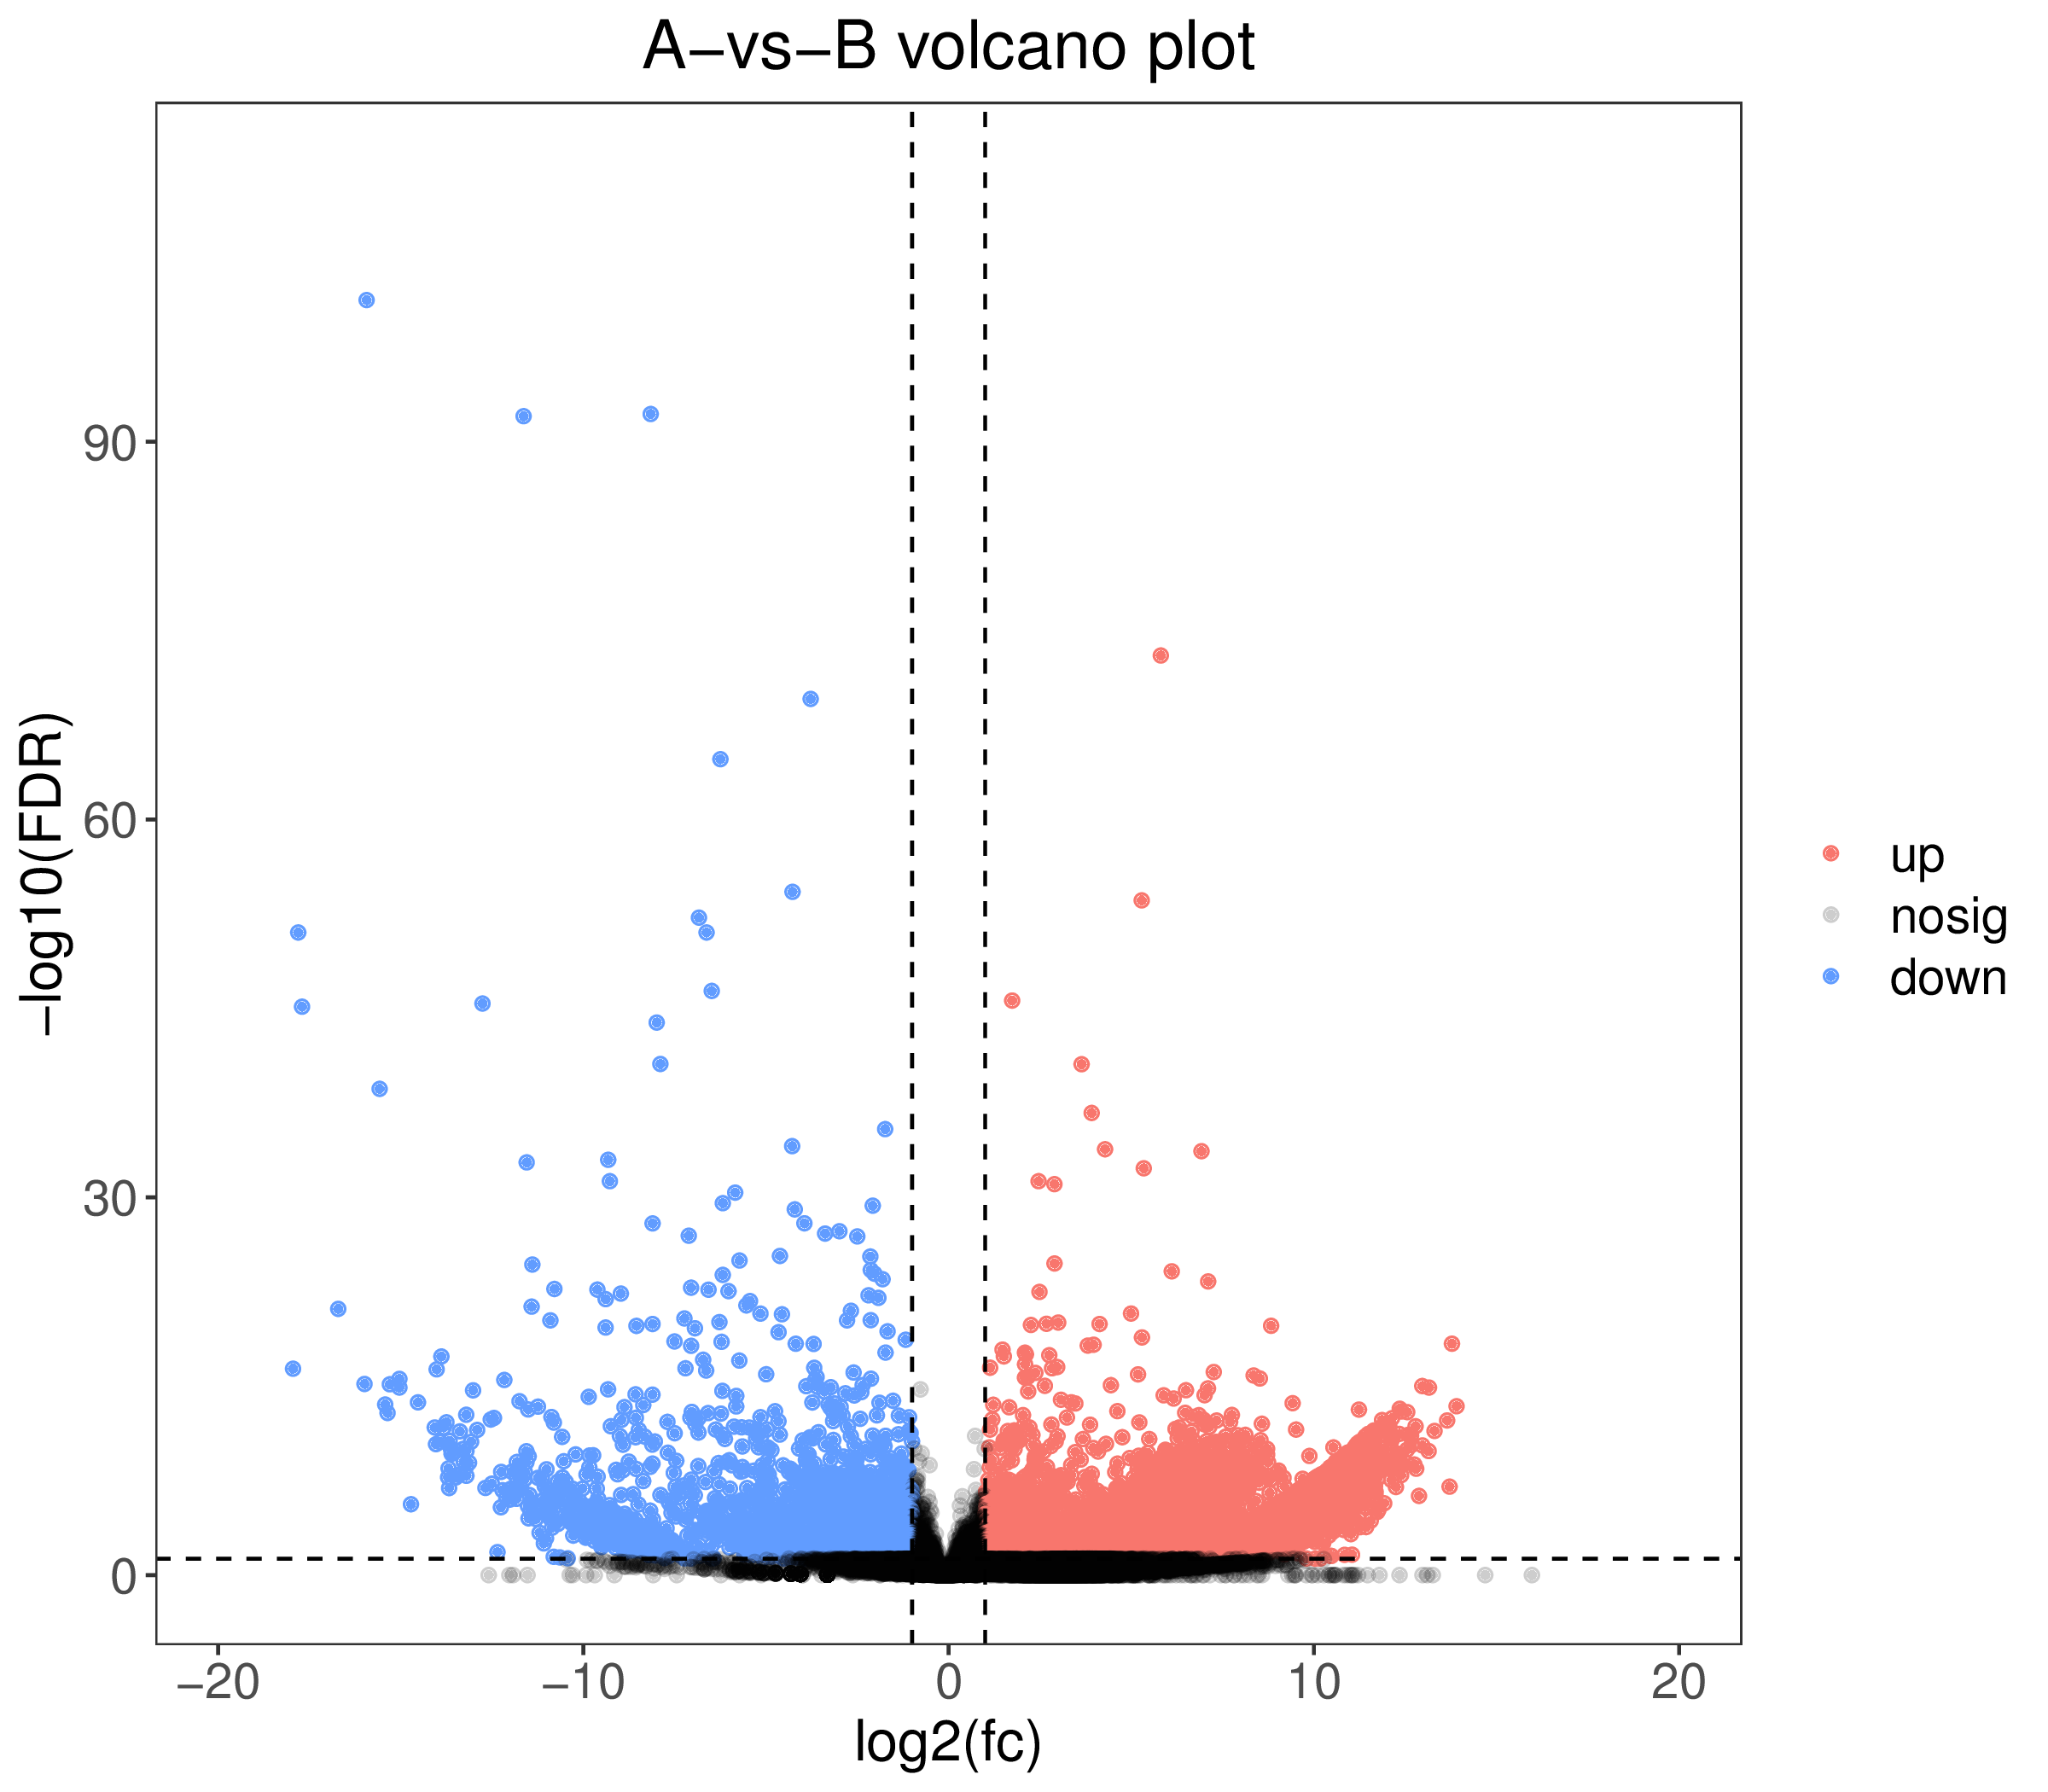
1. A-vs-B.DE.volcano.pdf:Differentially expressed genes volcano plot (vector figture)
2. A-vs-B.DE.volcano.png:Differentially expressed genes volcano plot (scalar figure)
3. A-vs-B.all.xls:Differentially expressed genes table
4. A-vs-B.filter.xls:Significantly differentially expressed genes table
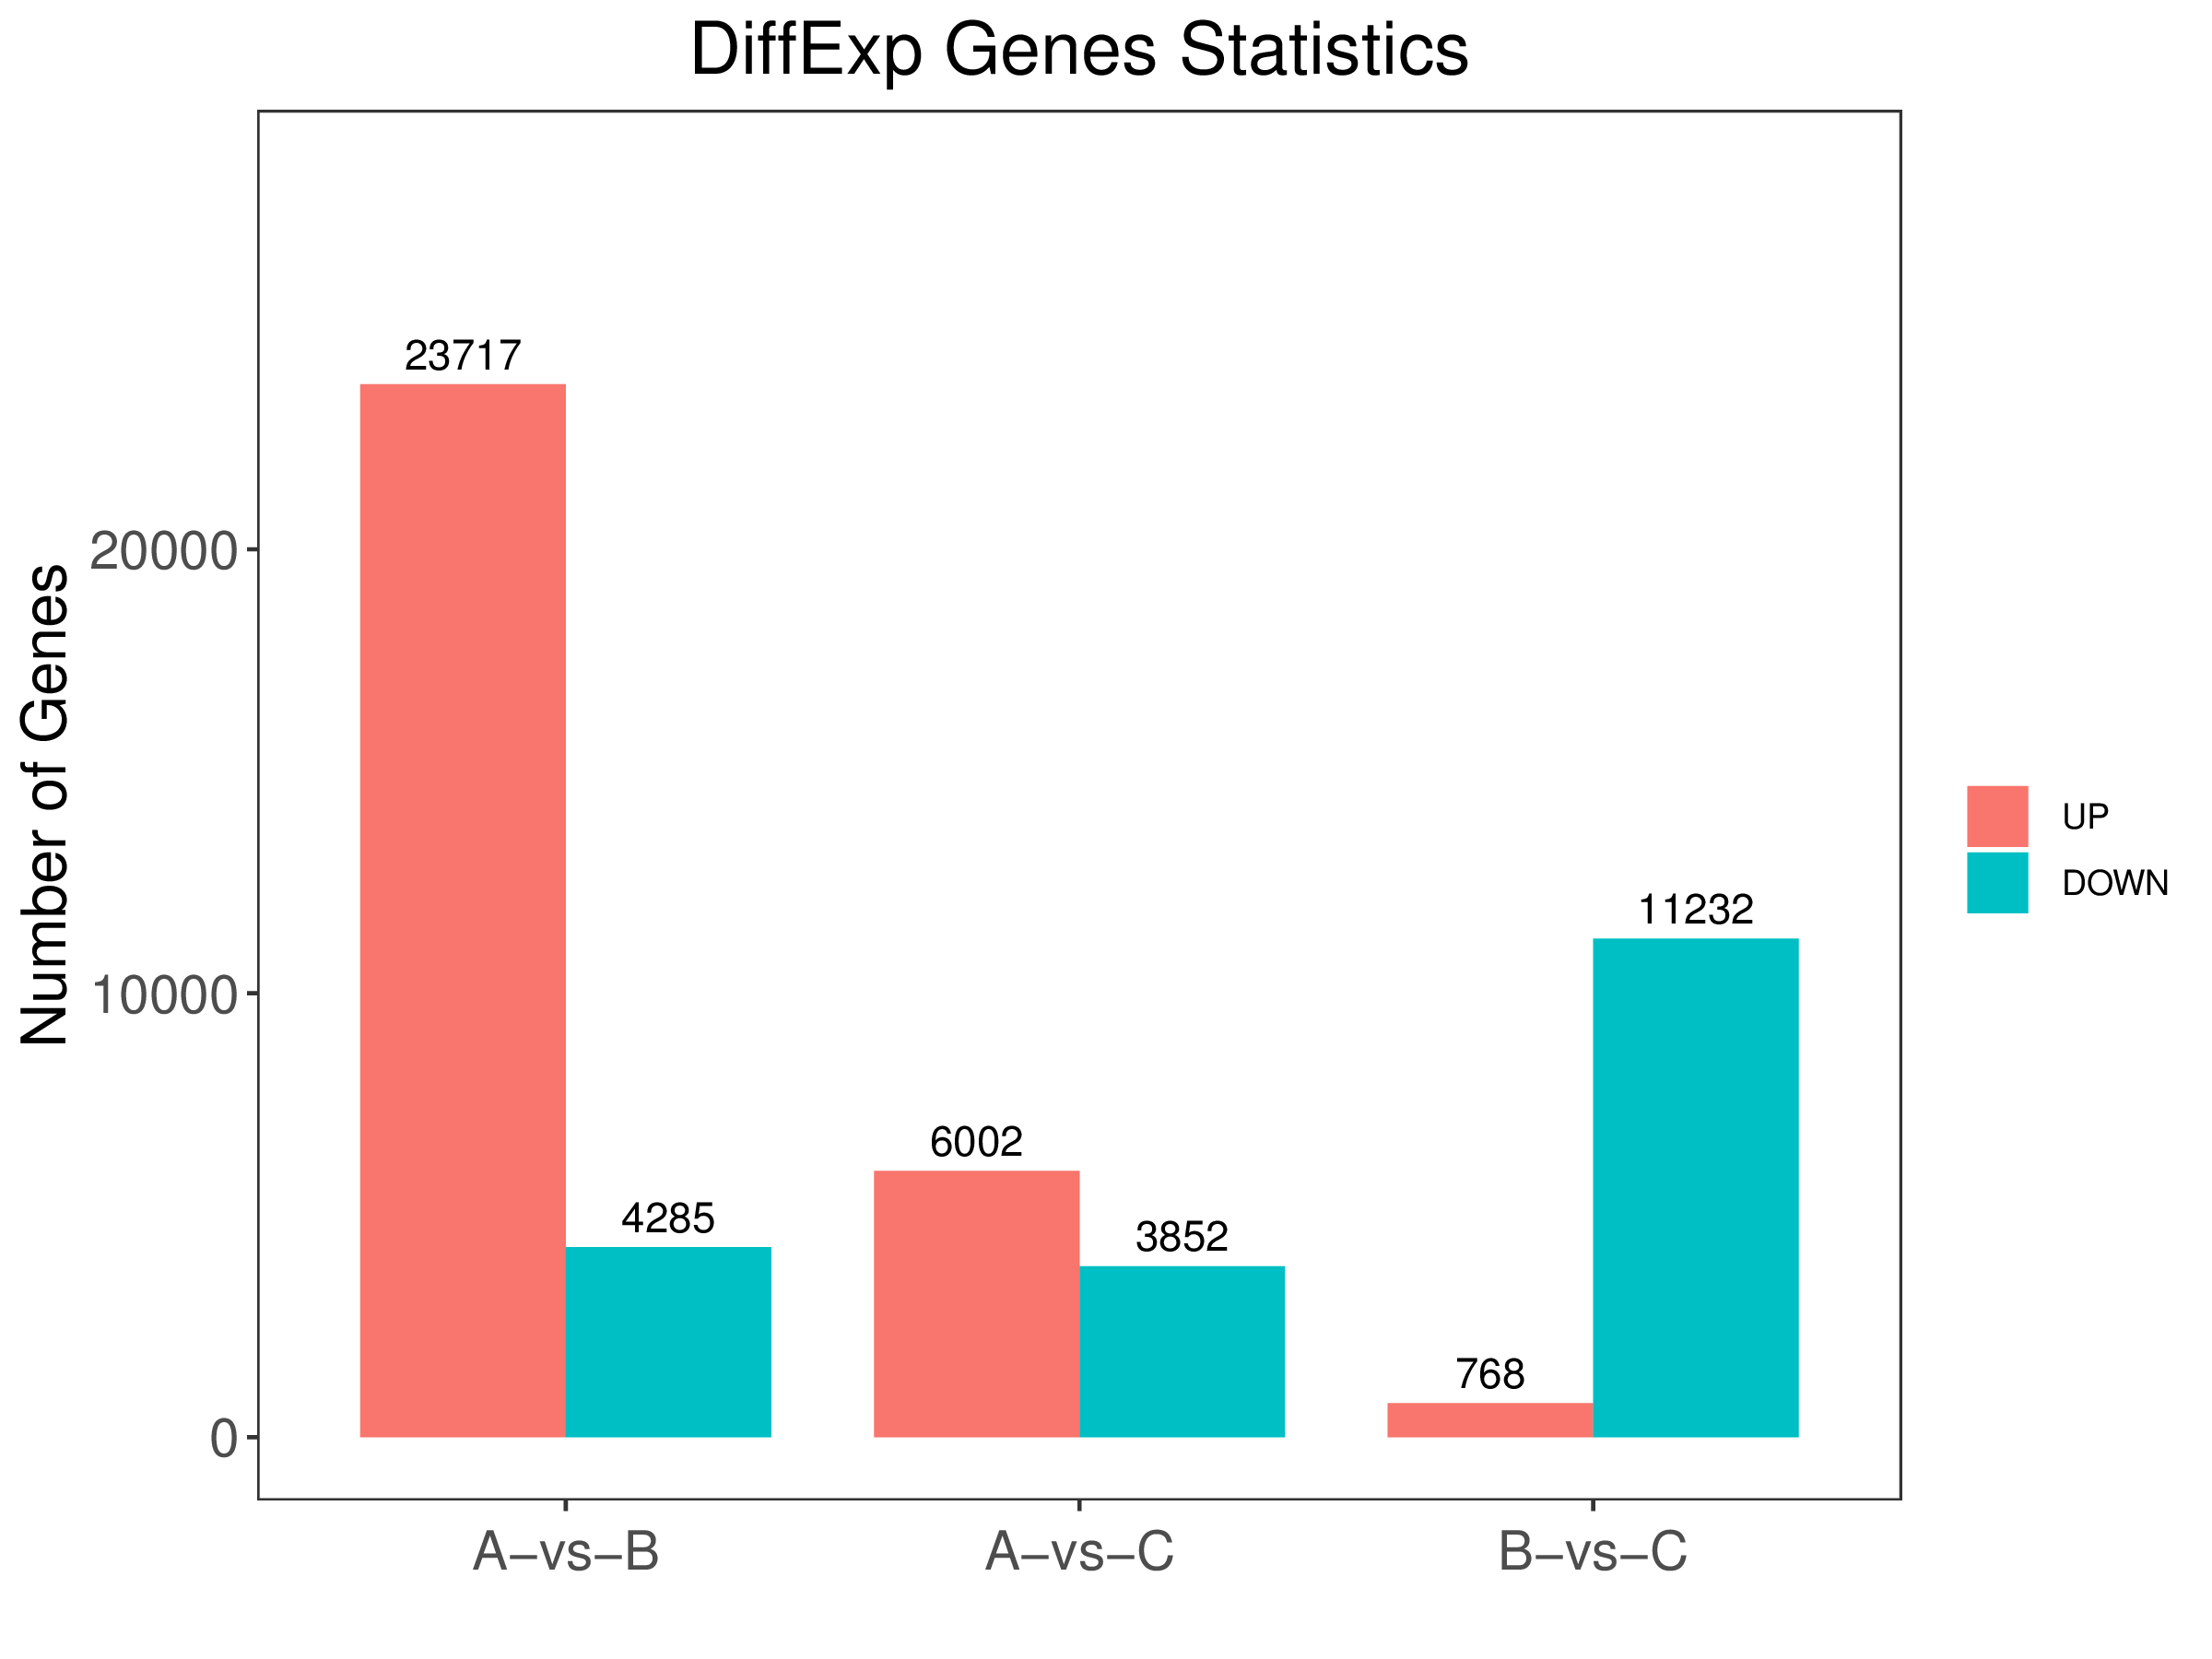
5. diff.stat.pdf:Differentially expressed genes histogram between comparison groups (vector figture)
6. diff.stat.png:Differentially expressed genes histogram between comparison groups (scalar figure)
7. diff.stat.xls:Differentially expressed genes table of all comparison groups
Example: Gene count table file Comparison file Grouping file
Output:
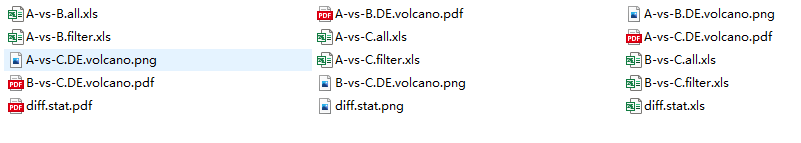
1、Results folder all the files:
2、Results all the comparison group of differentially expressed genes in the folder histogram :
3. Volcanic plot for difference analysis of the two groups of samples: