扫码支付更轻松

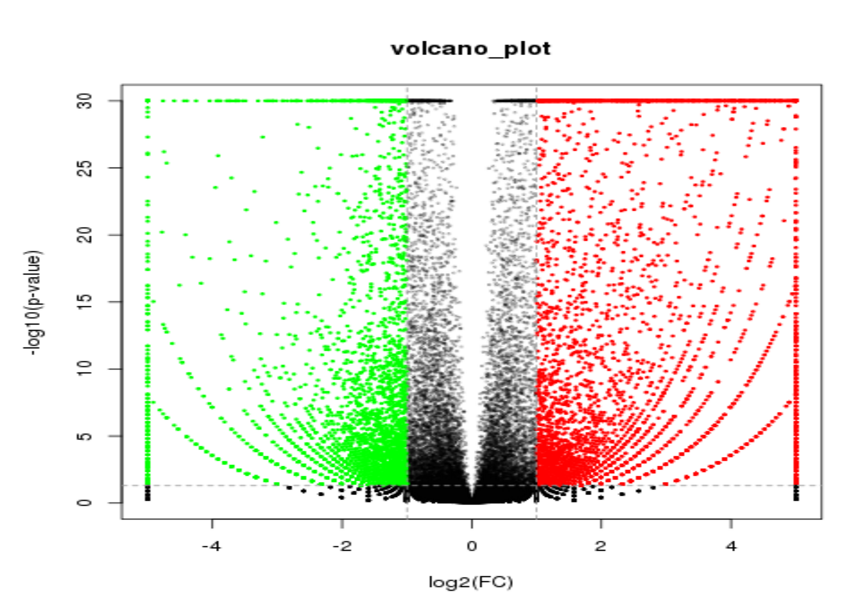
Function:
A type of scatter plot that displays significant difference between two groups of data. The x axis is the log2 of the fold change between two groups, and the y axis is the negative log2 of P value or Q value. By coloring significantly different points from other points, one can recognize the significant difference between two groups of data.
Input:
Upload a tab delimited text file with headers. If your data is not TAB delimited, you can use Excel to convert it.
Parameters:
①Column for x axis: column for log2(FC).
②Column for y axis: column for P value or Q value.
③Threshold of x axis: threshold of fold change. Usually 2 or 1.5.
④Threshold of y axis: threshold of P value or Q value. Usually 0.05 or 0.01.
Output:
A volcano plot in PNG/PDF format.
Example:
Volcano plot input fileOutput:
In the task interface, click on the “download” button to download volcano plot results in PNG and PDF format.