扫码支付更轻松

Function:
The Wilcoxon rank-sum test tool is used to determine whether two independent samples were selected from populations having the same distribution. Unlike the t-test it does not require the assumption of normal distributions.
Input:
Attention:Input tab delimited text files with headers. If your data is not TAB delimited, you can use Excel to convert it.
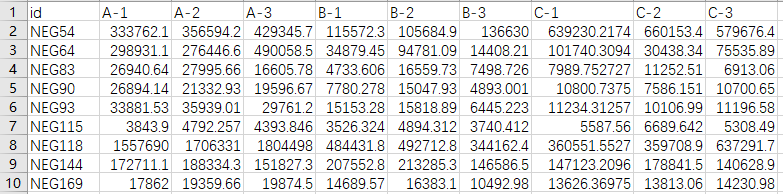
(1) Different analysis table file:Input a tab delimited text file with headers. The first row is sample names and the first column is variable name. Values in the table are variable value.Each group should have 3 samples at least, and multiple groups of samples should be compared in pairs
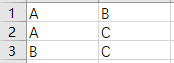
(2) Comparison file:Input a tab delimited text file where a row represents a comparison with the second column versus the first column.
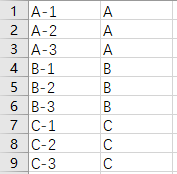
(3) Grouping file:Input a tab delimited text file where sample names in the first column and group names in the second column
Parameters:
(1)1) Test value: you can choose P value or Q value for test value. Q value (false discovery rate, FDR) is calculated by FDR correction of P value.
(2) Threshold for P value or Q value: Normally, the threshold for differential expression analysis is 0.05. You can also set the threshold according to your experiment, like 0.01 or 0.001.
(3)Threshold of fold change: The default of is 1, which means you dont think about fold change.
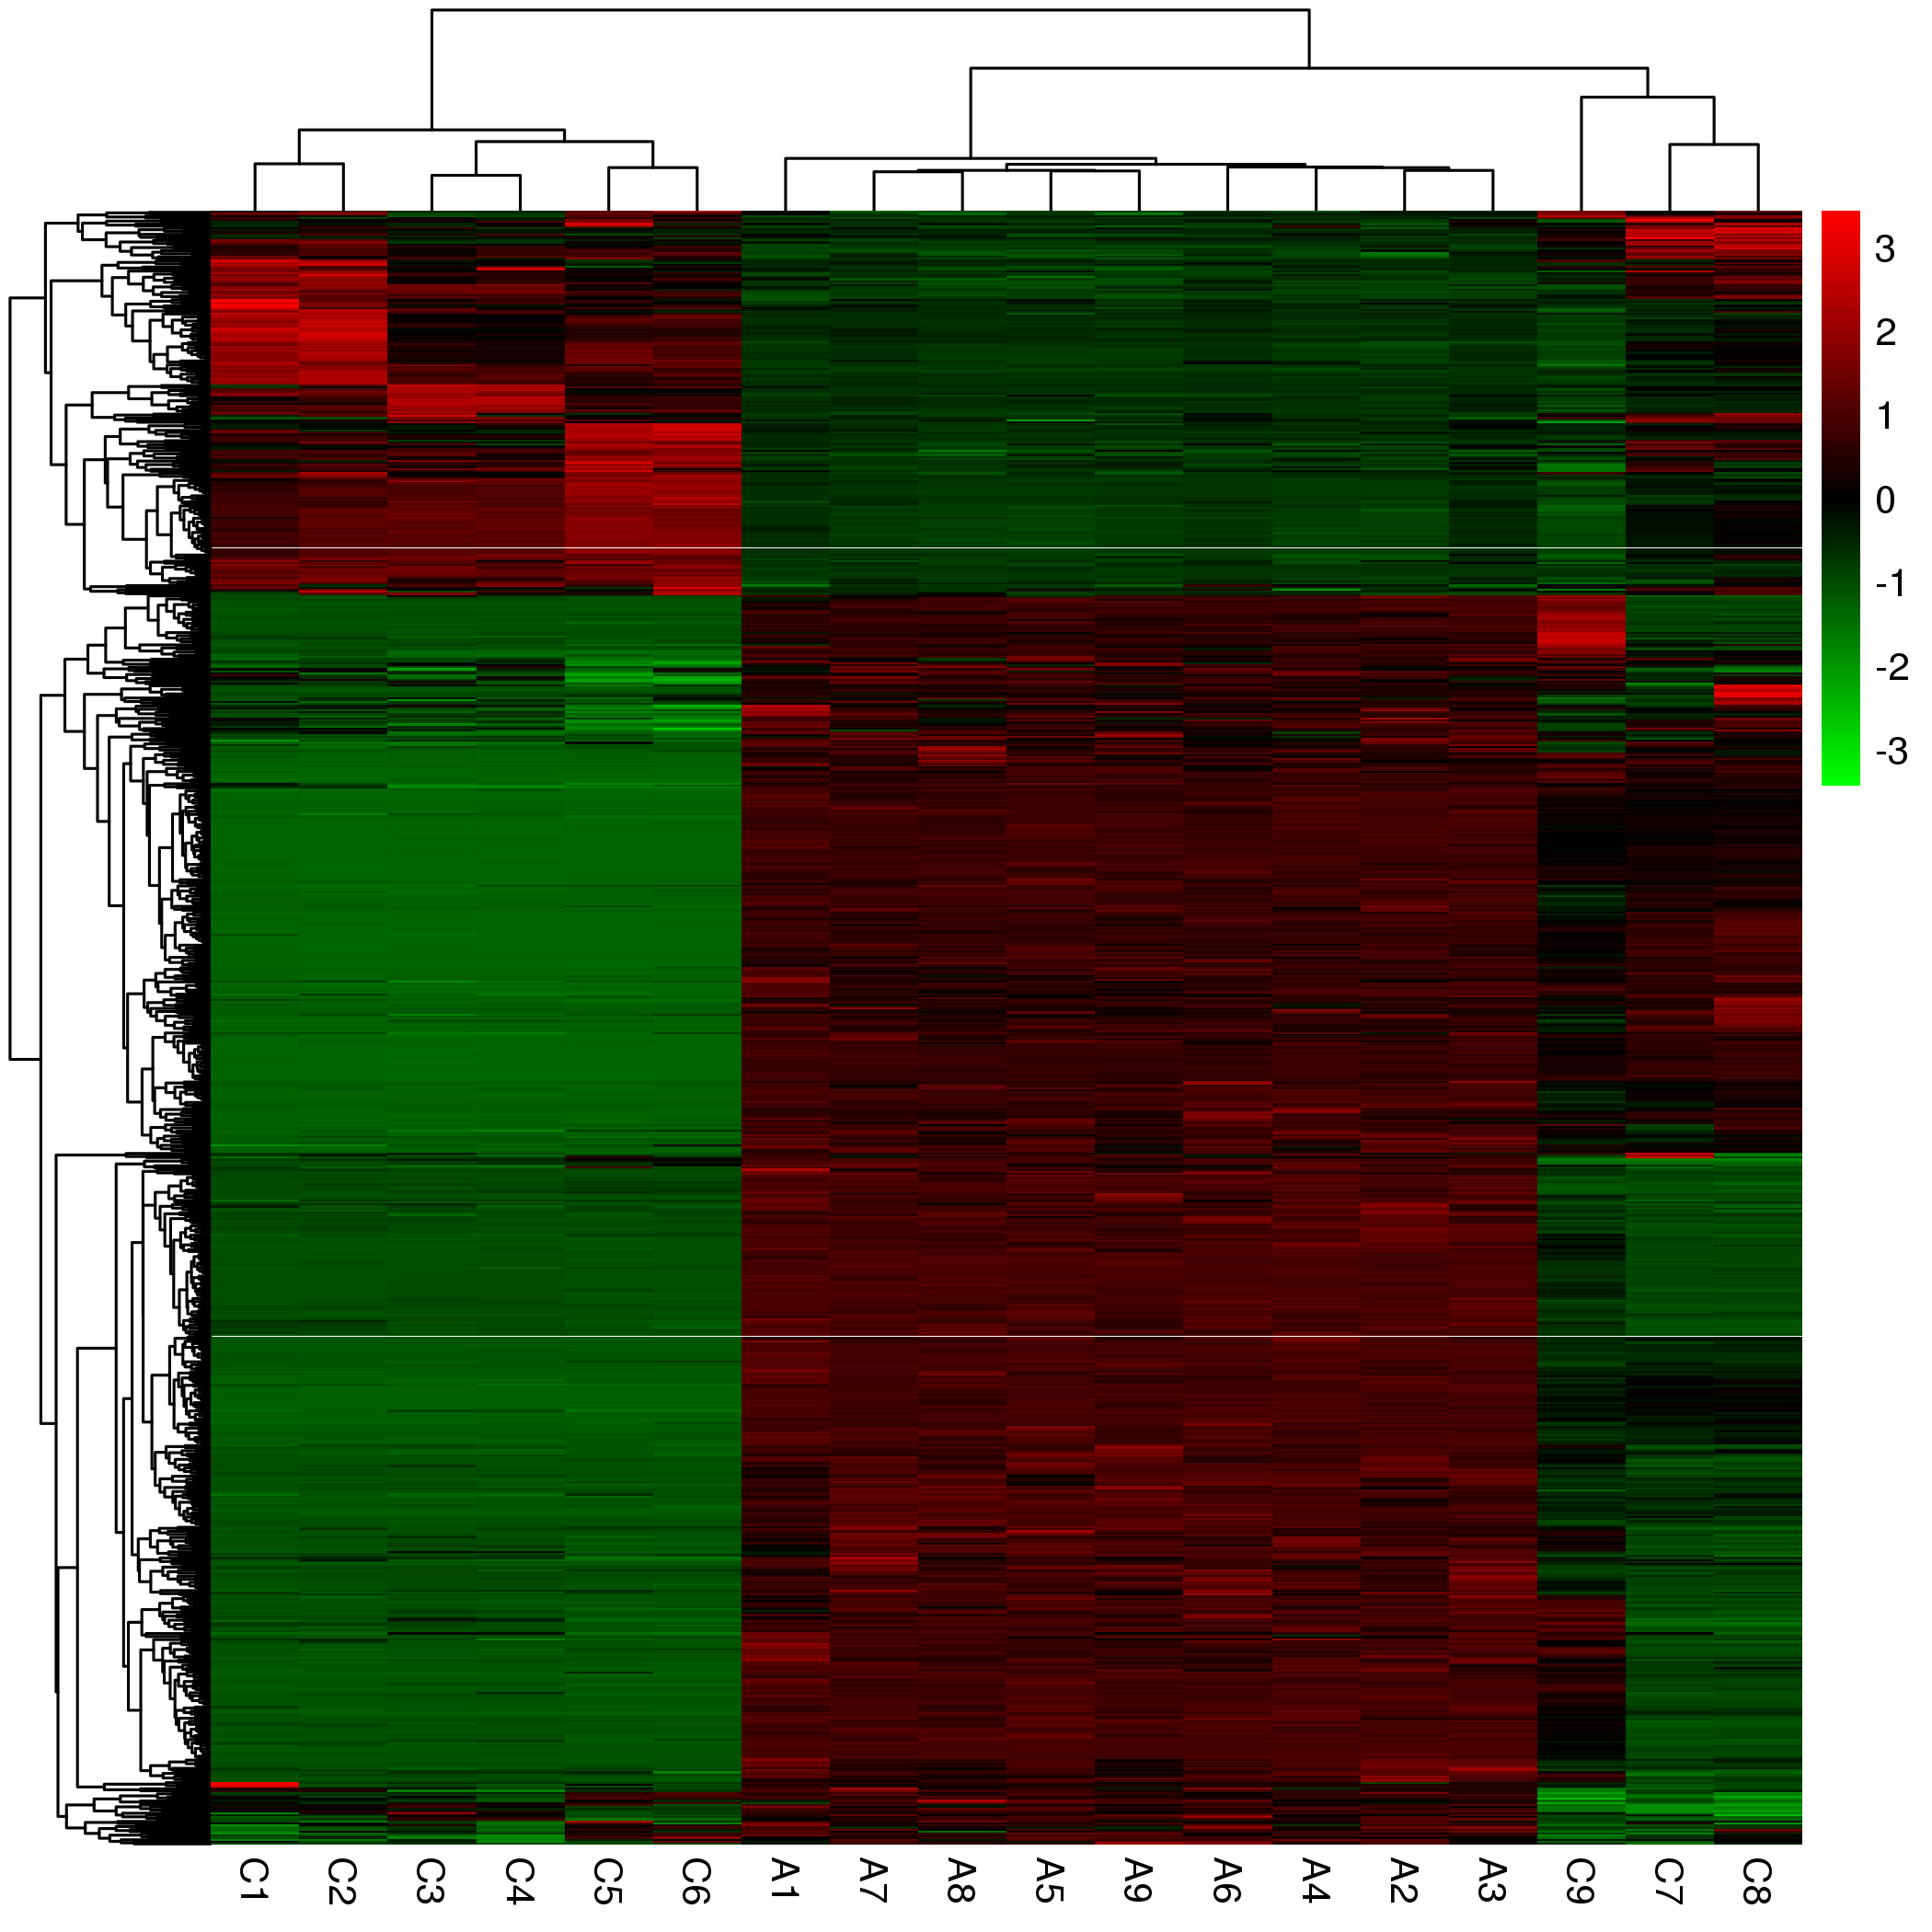
(4) Graph:The default is histogram, the optional graphs is heat map.
Output
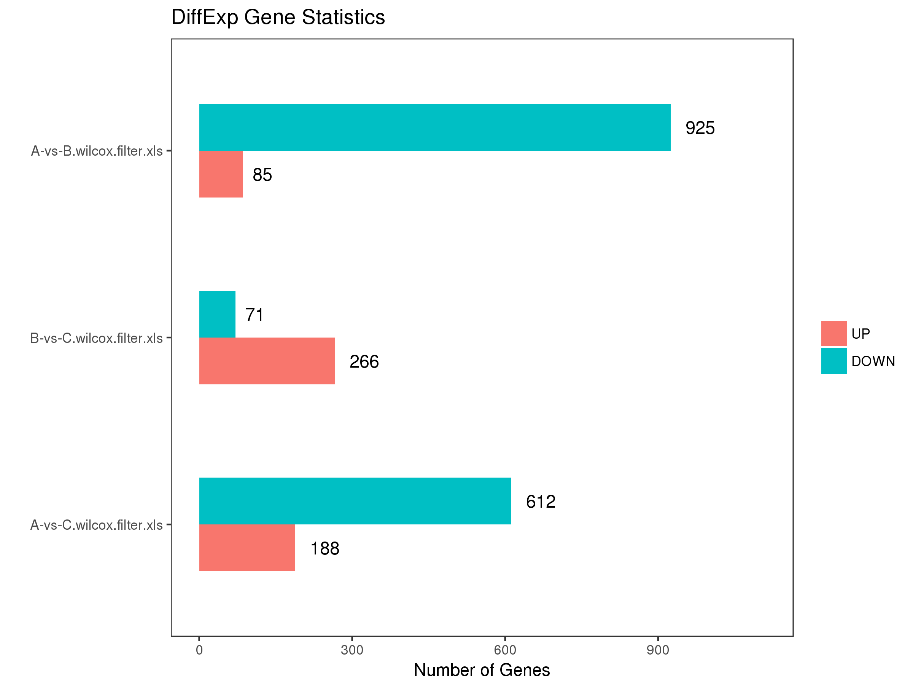
diff_stat.xls: statistical table of differential variable numbers
diff_stat.pdf/png: differential variable histogram between comparison groups (vector/scalar figure)
A-vs-B.wilcox.all.xls: Differentially variable values table
A-vs-B. Wilcox.filter.xls: Significantly differentially variable values table
A-vs-B.DE.heat map.pdf/png: Differentially variable values volcano plot (vector/scalar figure)
Example: Different analysis table file Comparison file Grouping file
Result graph:(The default is histogram, the optional graphs are heat map)

some result graphs: