


 扫码支付更轻松

Pathway enrichment analysis tool to use and interpret detailed tutorial
function:
KEGG pathway enrichment analysis provides not only pathway functional annotations of given gene set, but also pathway enrichment analysis. First, Gene numbers of each pathway in a given gene set is calculated. Then significantly enriched pathways in the given gene set comparing to the genome background are defined by hypergeometric test. The calculating formula of P-value is: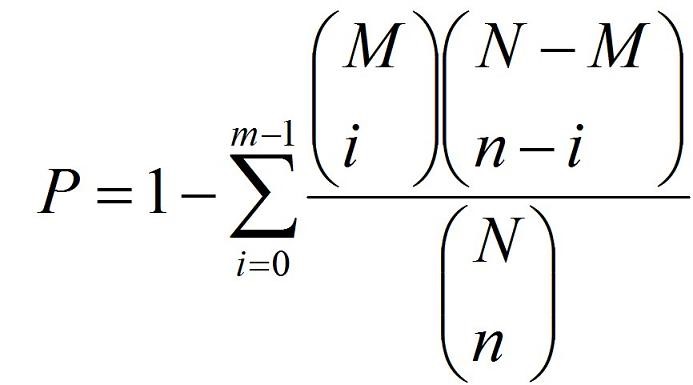
Here N is the number of all genes with KEGG pathway annotation; n is the gene number of given genes set in N; M is the number of all genes that are annotated to the certain pathway; m is the gene number in the given gene set that are annotated to the certain pathways. The calculated p-value is gone through FDR Correction, taking FDR ≤ 0.05 as a threshold. Pathways meeting this condition are defined as significantly enriched pathways in the given genes set.
Scope of application:
The gene sets of 18 common species can be enriched and analyzed, including bovine, zebrafish, human, macaque, mouse, rat, pig, elegans, drosophila, Arabidopsis, rice, tomato, wheat, corn, yeast, goat, chicken and indica rice, and 2 genomic versions are provided.
The background genes of the species can also be prepared by themselves for enrichment analysis.
Input:
①File format: a tab delimited text file. If your data is not TAB delimited, you can use Excel to convert it.
②Gene set: genes need enrichment analysis. Gene IDs must be separated by new lines and included in the background set. Notice that the file contains only true Gend ids, please check it on the example file.
③Background set: The gene list of background set, usually it's all genes of a genome. The first column is gene id, the second column is gene annotation id. There are three kinds of ID type available: keggid, ncibi-geneid, KO id.
④Gene expression fold change file: the first column is gene names, and the second column is log2 Fold Change value.
1.总览

2.Results statistics
3.statistical graph

4.Senior Bar graph

5.Senior Bubble plot
 (
(